Fig. A.1
Download original image
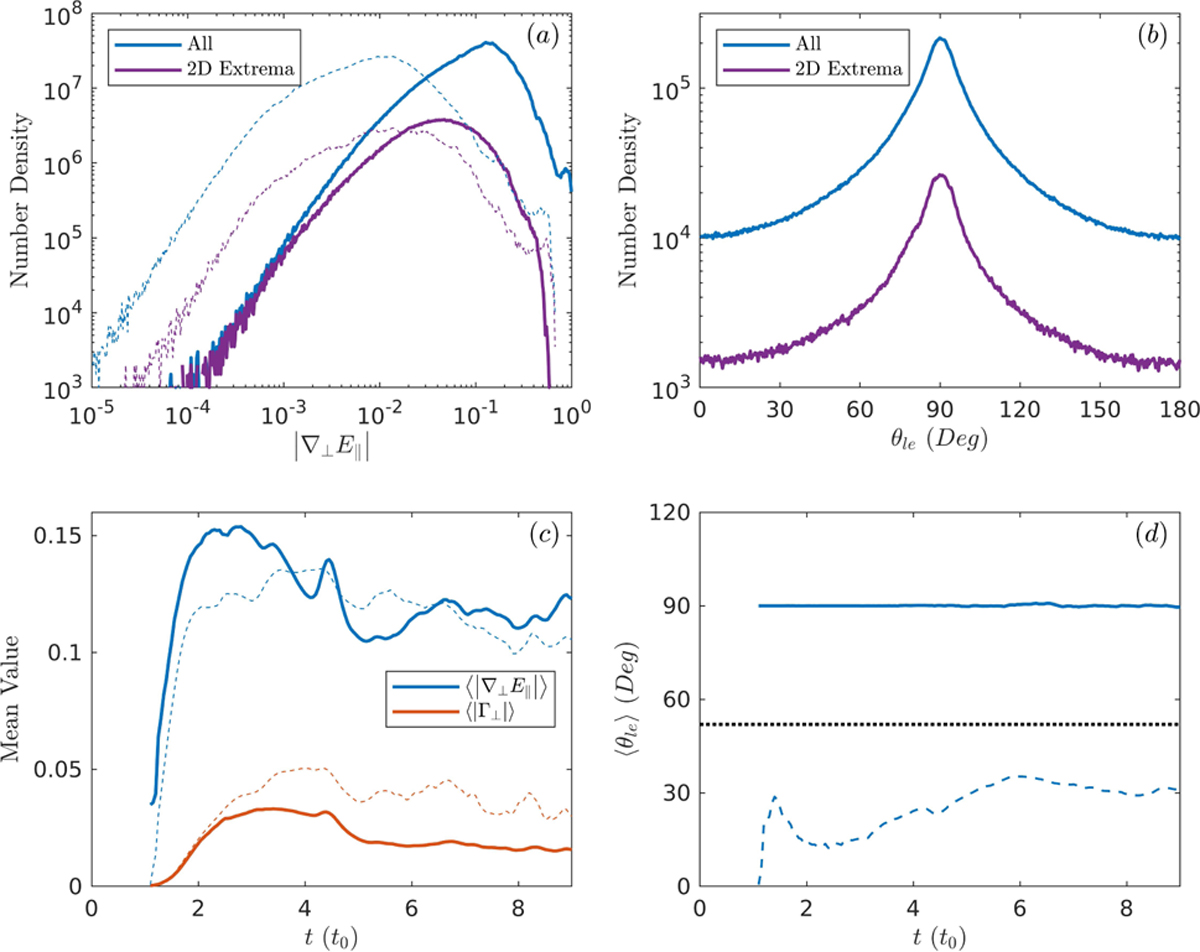
Statistical comparisons of ∇⊥ E‖ and Γ⊥ in the Harris-sheet simulation. Panel (a) plots the number densities of |∇⊥ E‖| (solid curves) and |Γ⊥| (dashed curves) at t = 9. Panel (b) shows the number densities of the angle θle spanned by Γ⊥ and ∇⊥ E‖ at t = 9. In panels (a) and (b), the blue curves depict all grids satisfying |J‖| ≥ 50 while the purple ones plot the subsets with 2D extremal E‖. Panel (c) depicts the time evolutions of the mean values of |∇⊥ E‖| (the blue solid curve) and |Γ⊥| (the orange solid curve). The blue and orange dashed curves plot the standard deviations of |∇⊥ E‖| and |Γ⊥|, respectively. Panel (d) exhibits the time evolutions of the mean values of θle (the solid curve) and its standard deviation (the dashed curve). The black dashed line denotes the theoretical standard deviation of a uniform random distribution sampled from 0° to 180°. The mean values and standard deviations in panels (c) and (d) are calculated from all grids satisfying |J‖| ≥ 50.
Current usage metrics show cumulative count of Article Views (full-text article views including HTML views, PDF and ePub downloads, according to the available data) and Abstracts Views on Vision4Press platform.
Data correspond to usage on the plateform after 2015. The current usage metrics is available 48-96 hours after online publication and is updated daily on week days.
Initial download of the metrics may take a while.