Fig. 8
Download original image
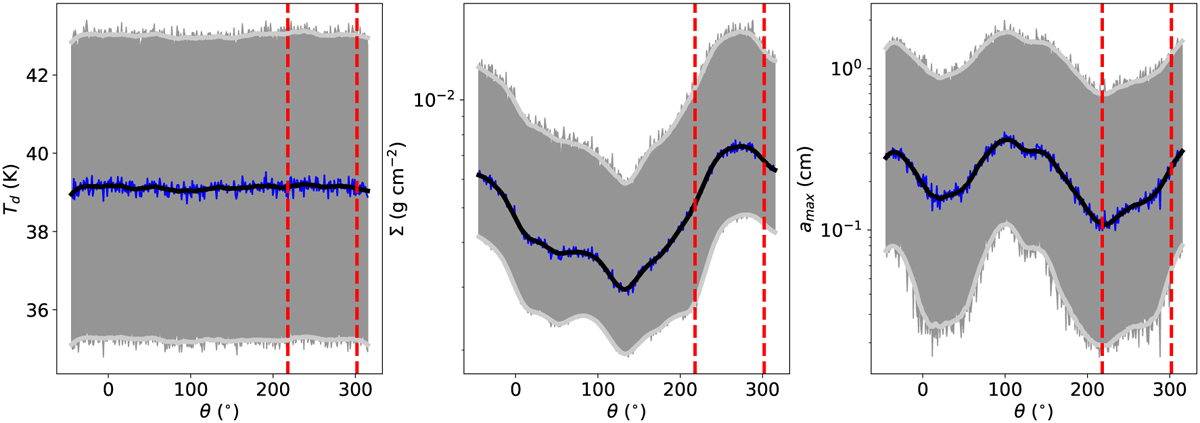
Results from fitting the azimuthal profiles of continuum emission with 1D isothermal slab models. The blue curve depicts the best value at each azimuth and for each parameter, while the thick black curve represents a smoothed version after applying a Savitzky-Golay filter with a window length of 51 and a polynomial of order 3. The dark gray shaded regions represent the 16 and 84% confidence levels. The light gray curves represent a smoothed version of the confidence levels after applying the same Savitzky-Golay filter. The red vertical dashed lines show the approximate azimuthal extent of the dust trap as traced by the 0.87, 1.1, and 2.2 mm continuum maps.
Current usage metrics show cumulative count of Article Views (full-text article views including HTML views, PDF and ePub downloads, according to the available data) and Abstracts Views on Vision4Press platform.
Data correspond to usage on the plateform after 2015. The current usage metrics is available 48-96 hours after online publication and is updated daily on week days.
Initial download of the metrics may take a while.