Fig. 1
Download original image
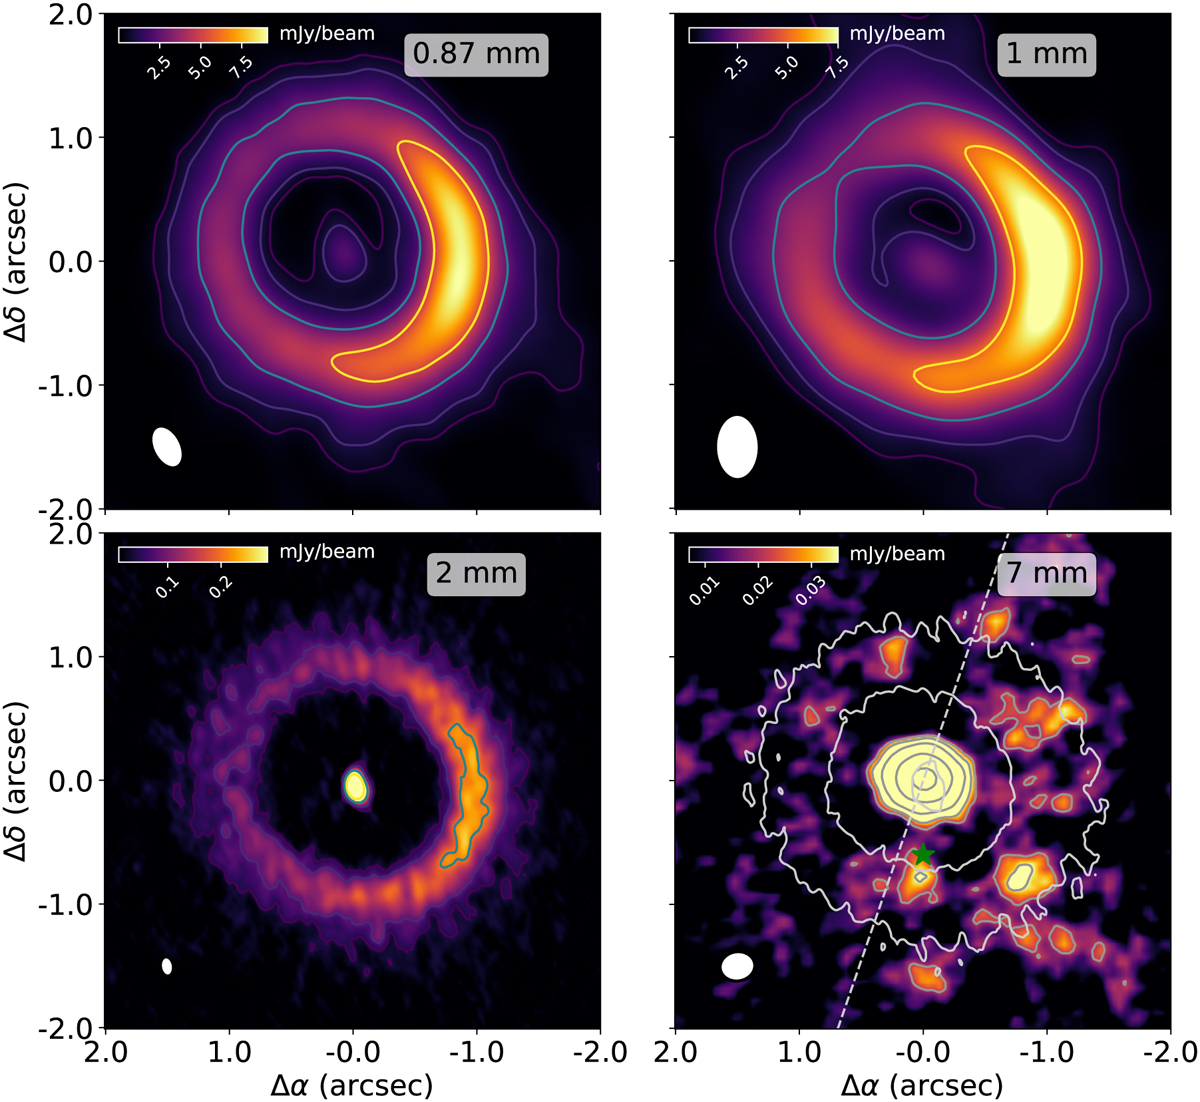
Continuum maps at millimeter wavelengths. Top left: ALMA map at 0.87 mm. Top right: NOEMA map at 1.1 mm. Bottom left: ALMA map at 2.2 mm. Bottom right: VLA map at 7 mm. The light gray contours in the bottom right panel depict 5σ continuum emission at 2.2 mm from our ALMA map. The gray dashed line marks the position of the centimeter jet detected by Rodríguez et al. (2014). The green star marks the position of the tentative protoplanet proposed by Currie et al. (2022). The synthesized beam is shown in the bottom left corner of each map. Contour levels in the 0.87, 1.1, and 6.8 mm maps are 5, 10, 25, and 50σ. The 2.2 mm map only shows 5, 10, and 25σ levels. The map of the VLA emission at 7 mm also includes 3σ contour levels. In all maps, the color bar indicates flux in mJy beam−1.
Current usage metrics show cumulative count of Article Views (full-text article views including HTML views, PDF and ePub downloads, according to the available data) and Abstracts Views on Vision4Press platform.
Data correspond to usage on the plateform after 2015. The current usage metrics is available 48-96 hours after online publication and is updated daily on week days.
Initial download of the metrics may take a while.