Fig. 9.
Download original image
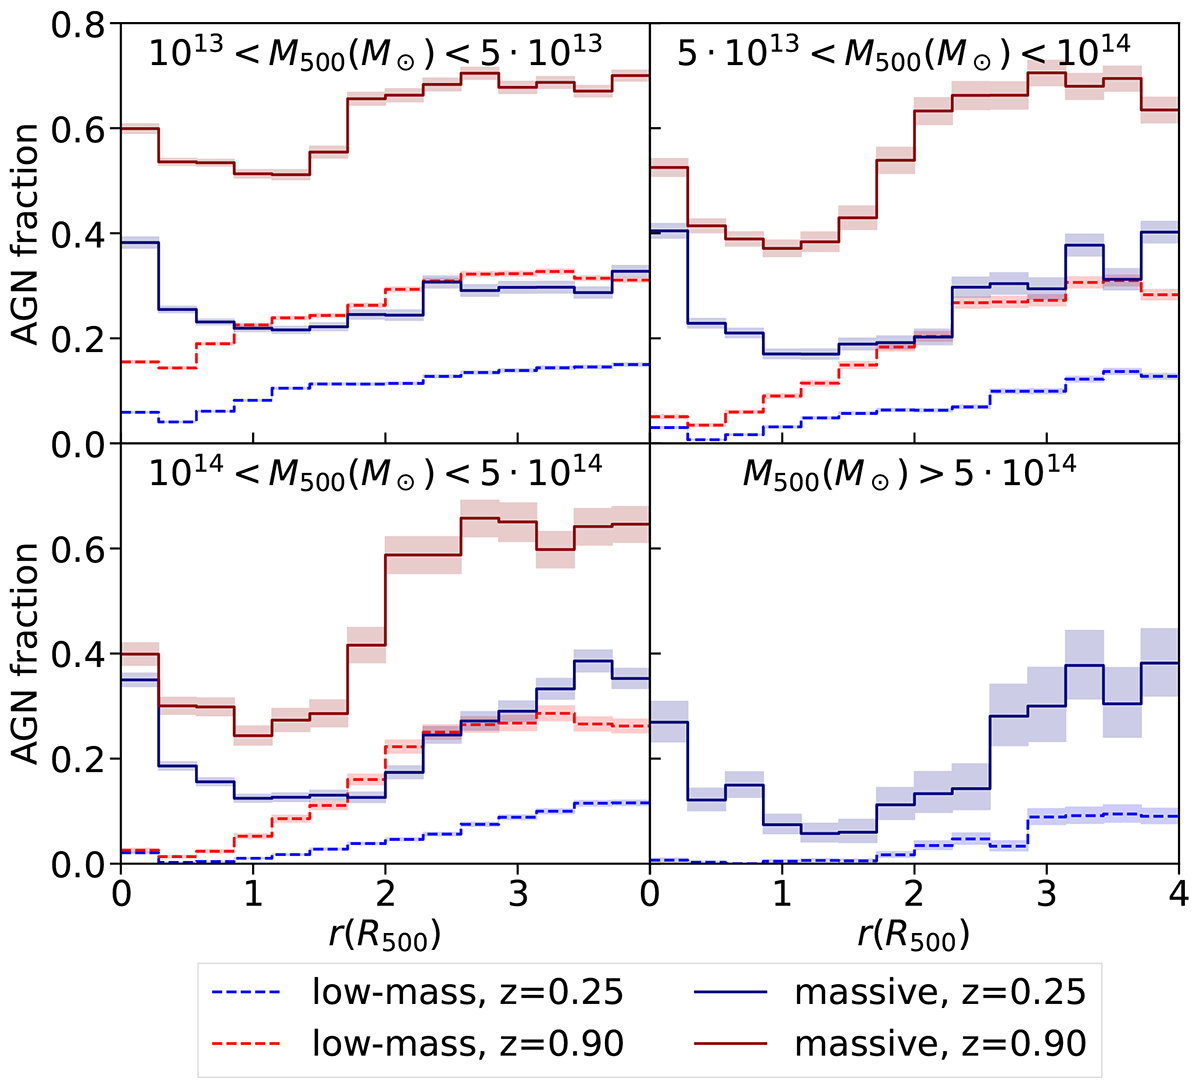
AGN fraction as a function of r, shown for low-mass (dashed line) and massive galaxies (solid line) at low redshift (in blue) and high redshift (in red). Each panel represents the AGN fraction in clusters of different mass M500 range. High-redshift massive clusters are omitted due to their low abundance and thus high statistical uncertainty. The coloured bands represent the 68% confidence intervals obtained with binomial statistics (see Sect. 3). Central BCGs are excluded.
Current usage metrics show cumulative count of Article Views (full-text article views including HTML views, PDF and ePub downloads, according to the available data) and Abstracts Views on Vision4Press platform.
Data correspond to usage on the plateform after 2015. The current usage metrics is available 48-96 hours after online publication and is updated daily on week days.
Initial download of the metrics may take a while.