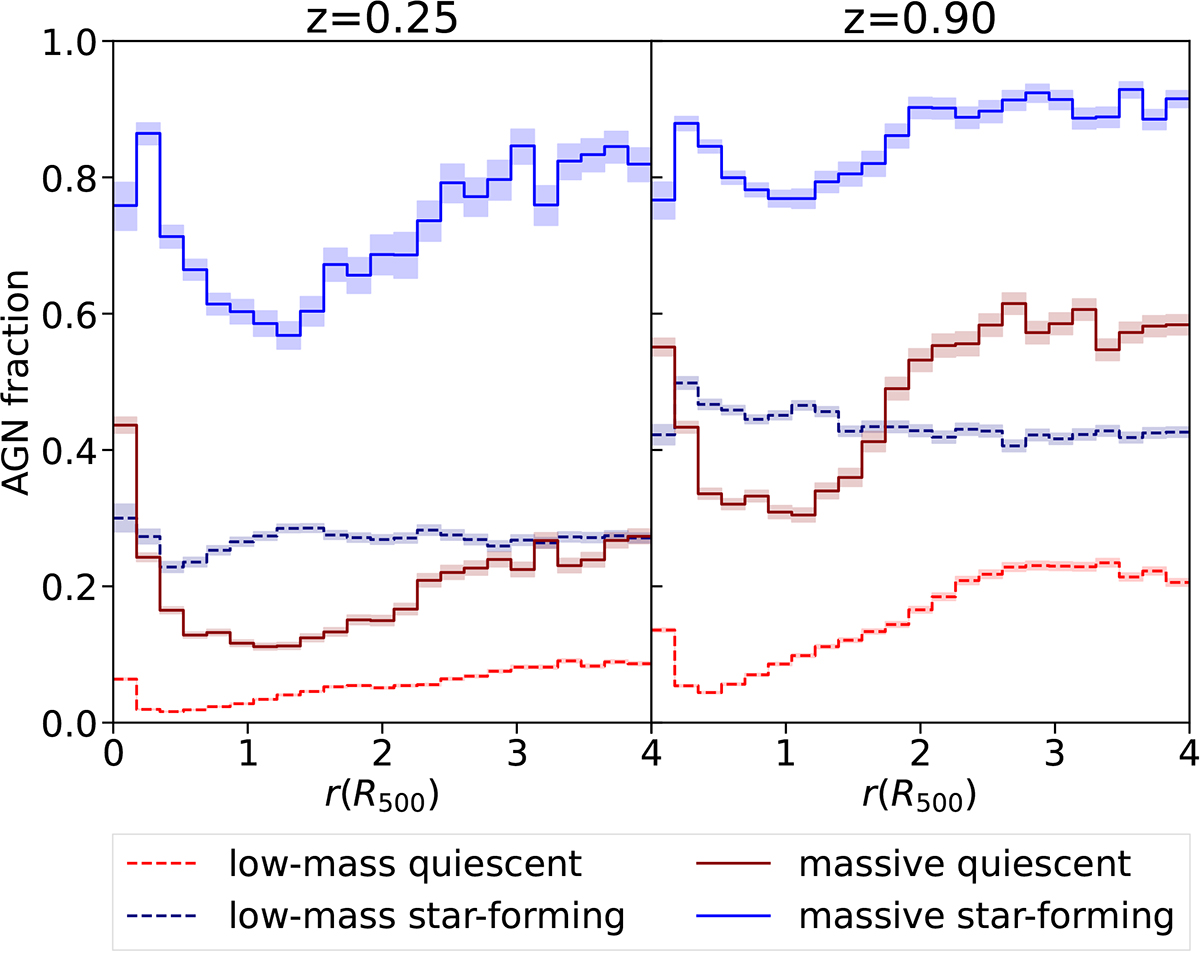
Fig. 8.
Download original image
Fraction of galaxies containing an X-ray-bright AGN as a function of r at low redshift (left panel) and high redshift (right panel). The AGN fraction is plotted separately for quiescent galaxies (in red), star-forming (in blue), low-mass (dashed line) and massive galaxies (solid line). The coloured bands represent the 68% confidence intervals obtained with binomial statistics (see Sect. 3). Central BCGs are excluded.
Current usage metrics show cumulative count of Article Views (full-text article views including HTML views, PDF and ePub downloads, according to the available data) and Abstracts Views on Vision4Press platform.
Data correspond to usage on the plateform after 2015. The current usage metrics is available 48-96 hours after online publication and is updated daily on week days.
Initial download of the metrics may take a while.