Fig. 7.
Download original image
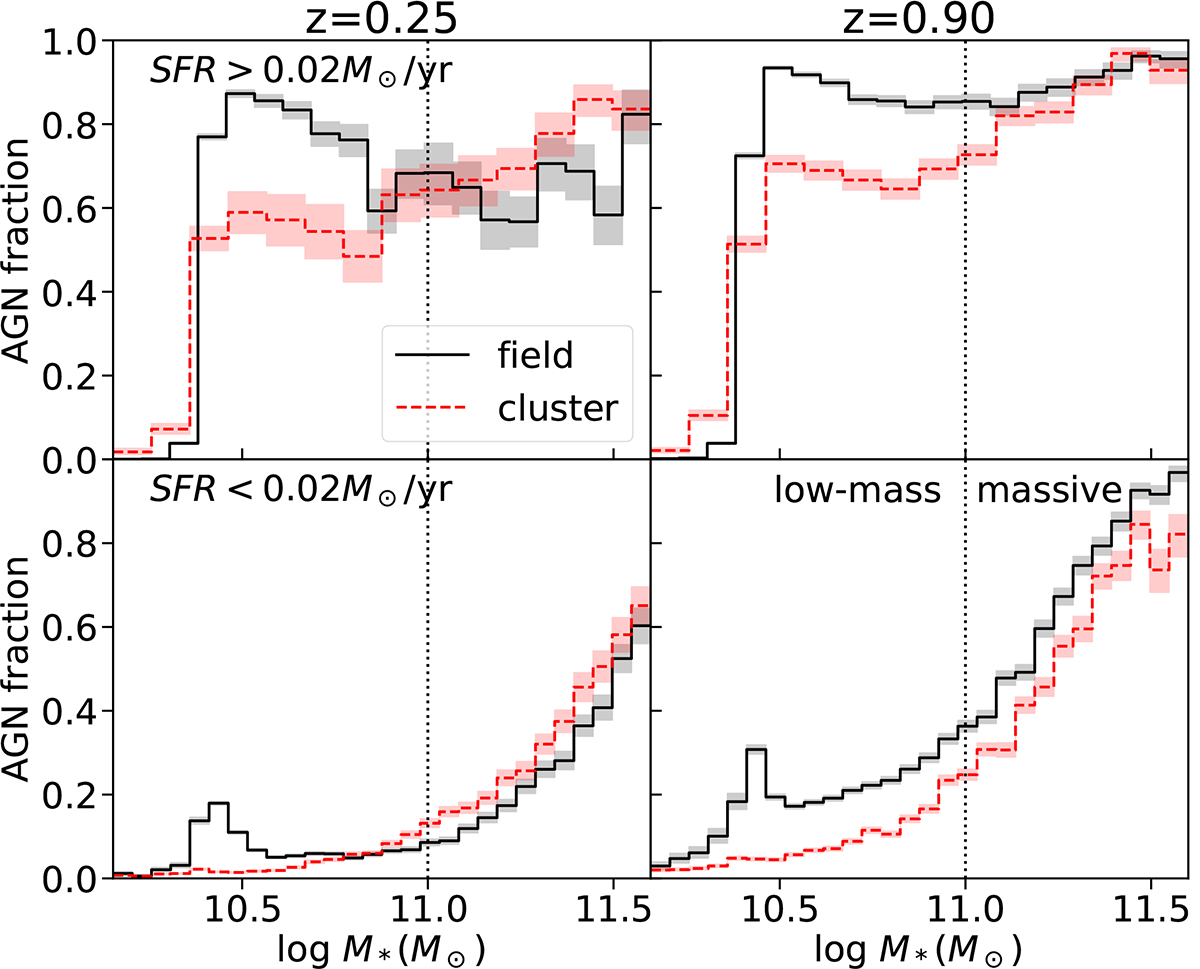
AGN fraction as a function of the stellar mass M* of star-forming (upper panels) and quiescent galaxies (lower panels) at high redshift (right panels) and low redshift (left panels). The solid line represents the AGN fraction of the field galaxies (galaxies in the isolated regions between 6 R500 and 7 R500 of each cluster) and the dashed line the ratio of galaxies in the cluster centre (below 0.4 R500). The dotted vertical line divides galaxies into low-mass and massive galaxies as defined in this work. The coloured bands represent the 68% confidence intervals obtained with binomial statistics (see Sect. 3).
Current usage metrics show cumulative count of Article Views (full-text article views including HTML views, PDF and ePub downloads, according to the available data) and Abstracts Views on Vision4Press platform.
Data correspond to usage on the plateform after 2015. The current usage metrics is available 48-96 hours after online publication and is updated daily on week days.
Initial download of the metrics may take a while.