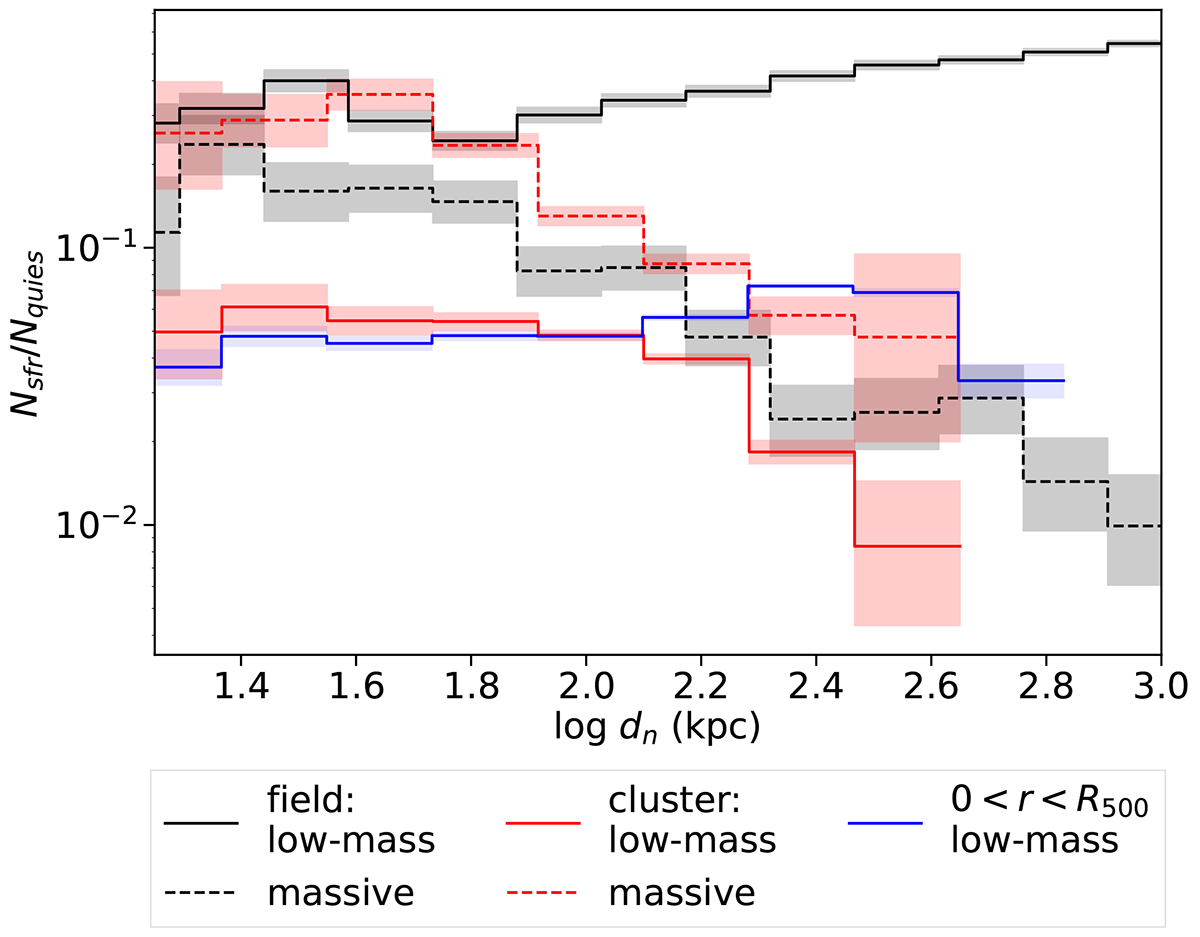
Fig. 6.
Download original image
Ratio between the number of star-forming (SFR > 0.02 M⊙ yr−1) and quiescent galaxies as a function of the distance to the nearest neighbour dn. Results are shown at low redshift for low-mass (solid line) and massive galaxies (dashed line). In black, we show the ratio of the field galaxies (galaxies in the isolated regions between 6 R500 and 7 R500 of each cluster) and in red the ratio of galaxies in the inner cluster regions (0.25 R500 < r < 0.5 R500). Narrow radial bins are selected to disentangle the local density effects from radial dependence; their importance is demonstrated with a blue solid plot, depicting low-mass population in a wider radial bin (0 < r < R500). BCGs are excluded in all plots. The coloured bands represent the 68% confidence intervals obtained with Poisson statistics (see Sect. 3).
Current usage metrics show cumulative count of Article Views (full-text article views including HTML views, PDF and ePub downloads, according to the available data) and Abstracts Views on Vision4Press platform.
Data correspond to usage on the plateform after 2015. The current usage metrics is available 48-96 hours after online publication and is updated daily on week days.
Initial download of the metrics may take a while.