Fig. 5.
Download original image
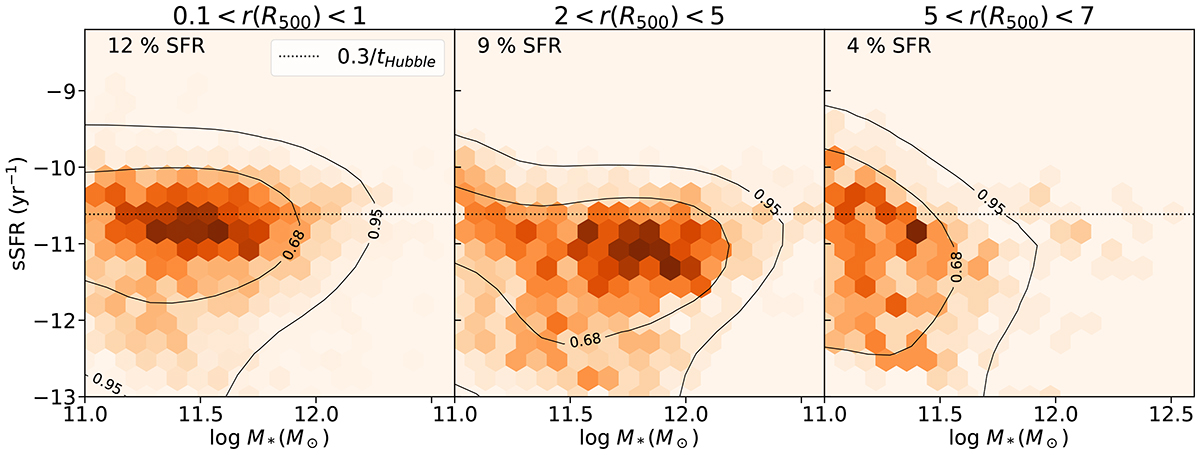
Distribution of stellar mass M* and sSFR of massive galaxies at different clustercentric distances r. Only isolated regions were selected. The dashed line indicates the conventional division between star-forming and quiescent used in some other works (Franx et al. 2008). In the top left corner of each panel, the fraction of star-forming galaxies (SFR > 0.02 M⊙ yr−1) in each region is shown. The contours show regions containing 68% and 95% of galaxies. The color range is normalised to the total number of galaxies in each panel. Results are shown at low redshift (z = 0.25).
Current usage metrics show cumulative count of Article Views (full-text article views including HTML views, PDF and ePub downloads, according to the available data) and Abstracts Views on Vision4Press platform.
Data correspond to usage on the plateform after 2015. The current usage metrics is available 48-96 hours after online publication and is updated daily on week days.
Initial download of the metrics may take a while.