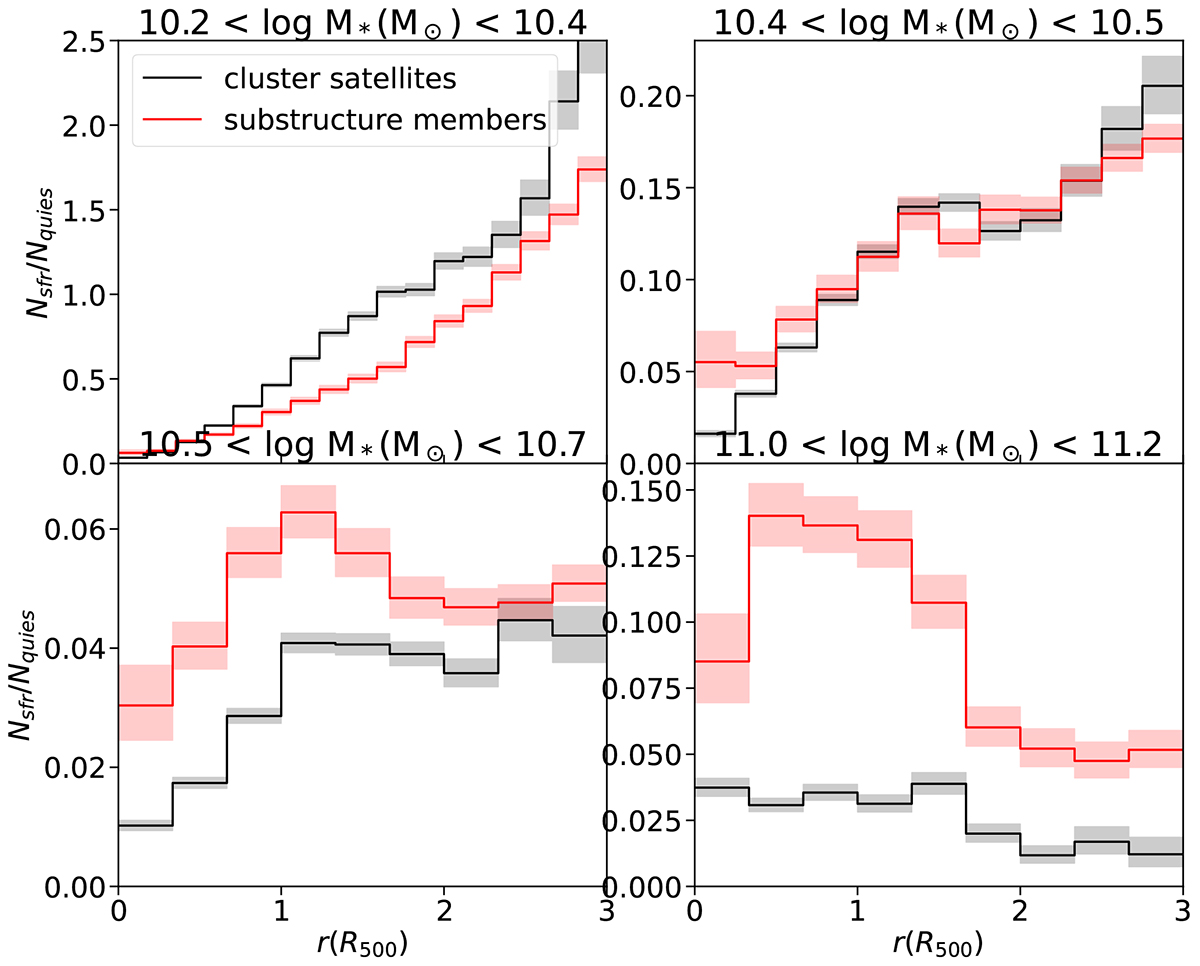
Fig. 4.
Download original image
Star-forming ratio as a function of r for galaxies in four different M* ranges (different panels). The red line represents galaxies that are embedded in substructures with at least two galaxies with log M*(M⊙) > 10.15. The black line represents single galaxies that orbit the cluster alone. Central BCGs are excluded. The coloured bands represent the 68% confidence intervals obtained with Poisson statistics (see Sect. 3).
Current usage metrics show cumulative count of Article Views (full-text article views including HTML views, PDF and ePub downloads, according to the available data) and Abstracts Views on Vision4Press platform.
Data correspond to usage on the plateform after 2015. The current usage metrics is available 48-96 hours after online publication and is updated daily on week days.
Initial download of the metrics may take a while.