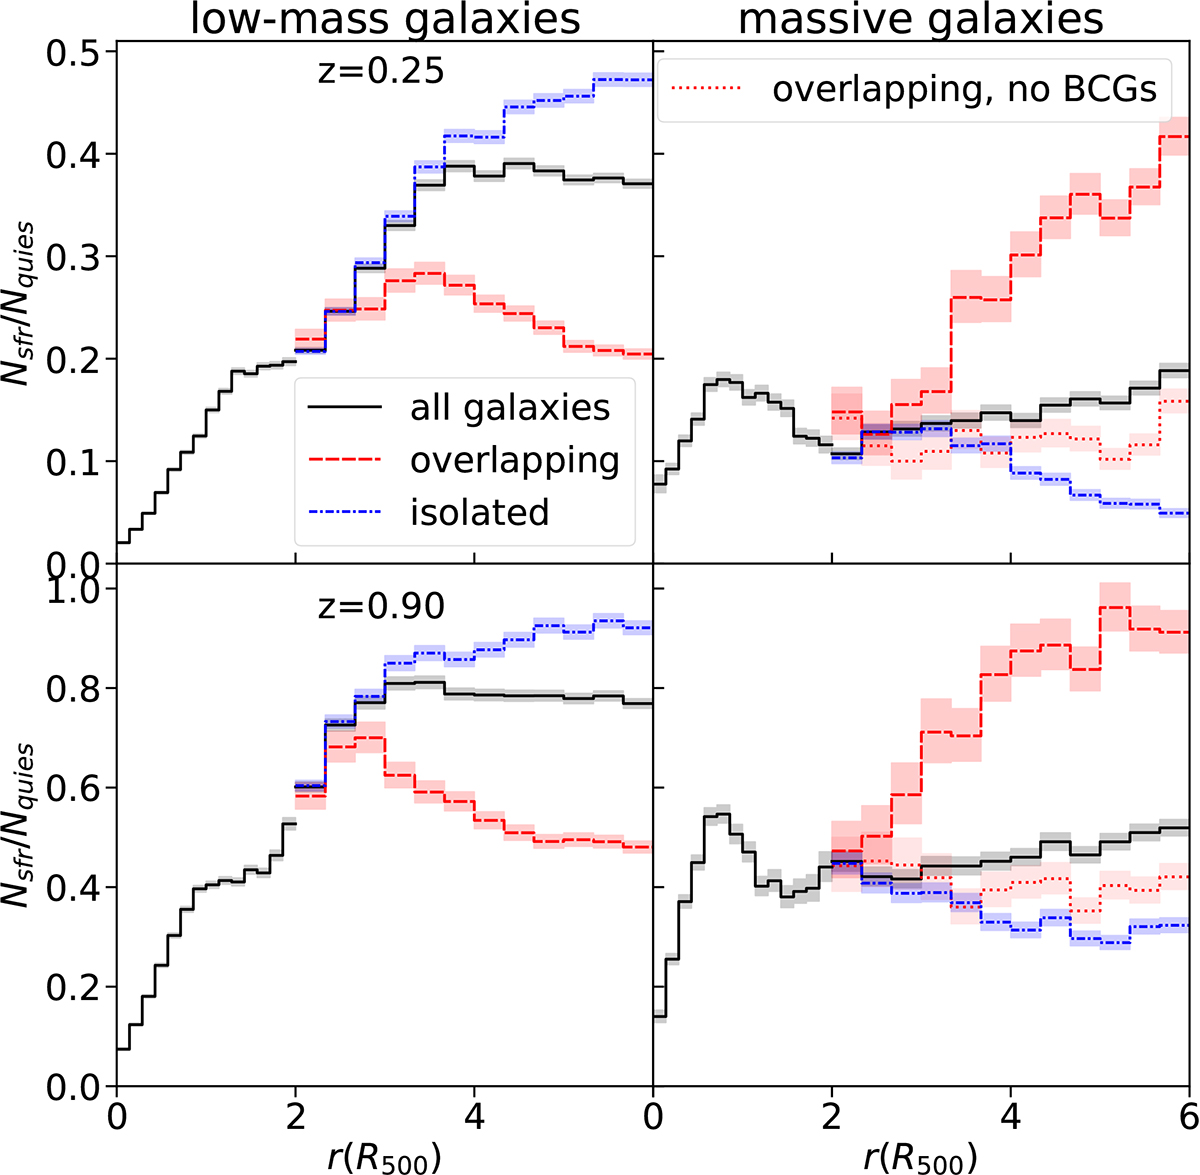
Fig. 3.
Download original image
Ratio between the number of star-forming (SFR > 0.02 M⊙ yr−1) and quiescent galaxies as a function of clustercentric distance r. Low-mass galaxies (10.15 < log M*(M⊙) < 11) are shown on the left and massive galaxies (log M*(M⊙) > 11) on the right. Results are shown at low redshift (upper panels) and high redshift (lower panels). For r > 2 R500 we separately plot the profiles of the overlapping and isolated regions (rov = 6 R500, see Sect. 3). On the right panels, the dotted line represents the massive overlapping populations without the BCGs of the neighbouring clusters, central BCGs are excluded in all plots. The coloured bands represent the 68 % confidence intervals obtained with Poisson statistics (see Sect. 3).
Current usage metrics show cumulative count of Article Views (full-text article views including HTML views, PDF and ePub downloads, according to the available data) and Abstracts Views on Vision4Press platform.
Data correspond to usage on the plateform after 2015. The current usage metrics is available 48-96 hours after online publication and is updated daily on week days.
Initial download of the metrics may take a while.