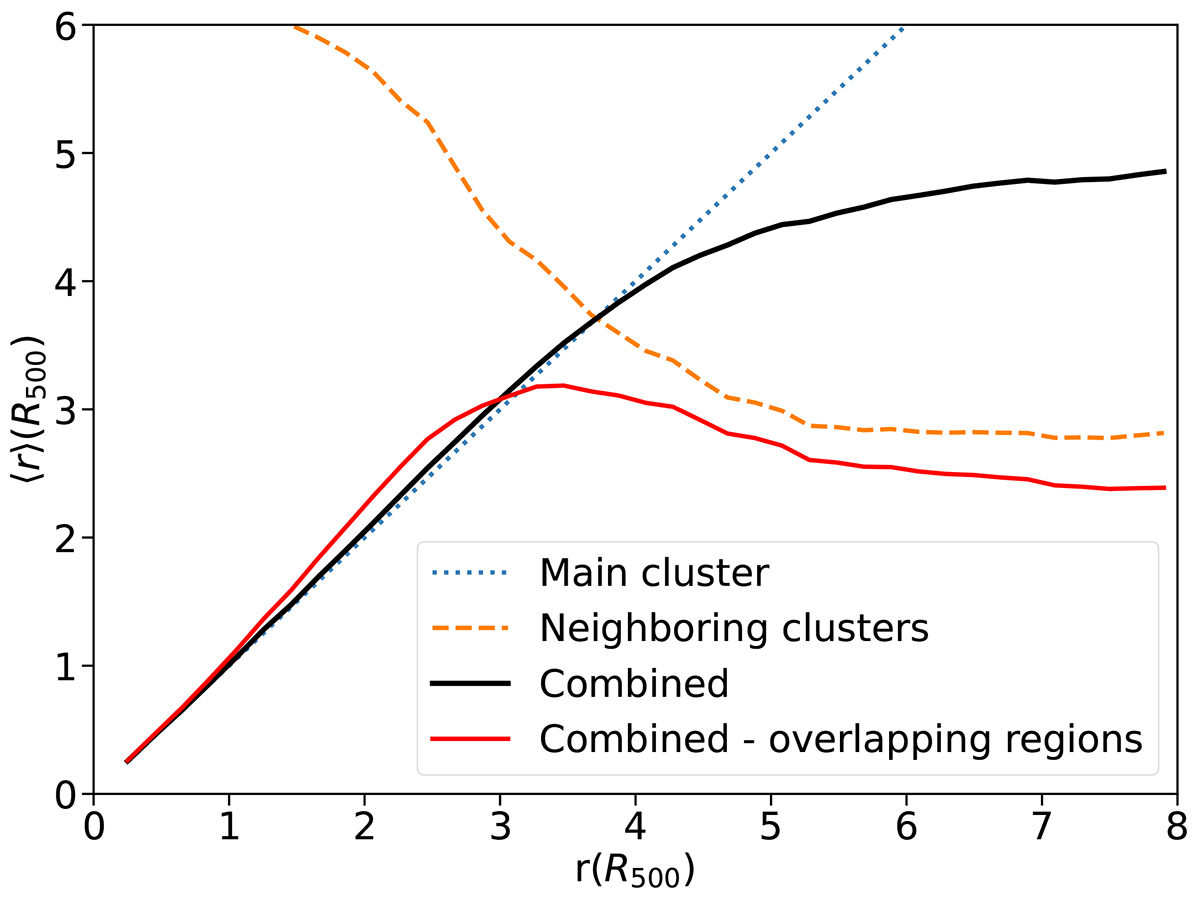
Fig. 2.
Download original image
Characteristic distance ⟨r⟩ (Eq. (1) where p(r) = r) as a function of the clustercentric distance computed at low redshift (z = 0.25) with procedure and definition of neighbouring clusters described in Sect. 4.1. Clustercentric distance r is given in R500 of the central clusters and the characteristic distance ⟨r⟩ is given in R500 of all clusters in the calculation (central or neighbouring). In the calculation of the blue dotted profile, only the contributions of the central clusters are considered, and all distances contributing to ⟨r⟩ are given relative to R500 of the central cluster. In the calculations of the dashed orange profile, the contributions of neighbouring clusters are considered – each neighbouring cluster contributes a number of galaxies with distances, given relative to its R500. The black profile is the combined profile of central and neighbouring clusters. As the distances are rescaled to different R500, ⟨r⟩ should be seen as a proxy for the properties of galaxies at some distance r, rather than the measure of the local density. Red solid line is calculated in the same way as the combined profile (black solid line) but in the overlapping regions only.
Current usage metrics show cumulative count of Article Views (full-text article views including HTML views, PDF and ePub downloads, according to the available data) and Abstracts Views on Vision4Press platform.
Data correspond to usage on the plateform after 2015. The current usage metrics is available 48-96 hours after online publication and is updated daily on week days.
Initial download of the metrics may take a while.