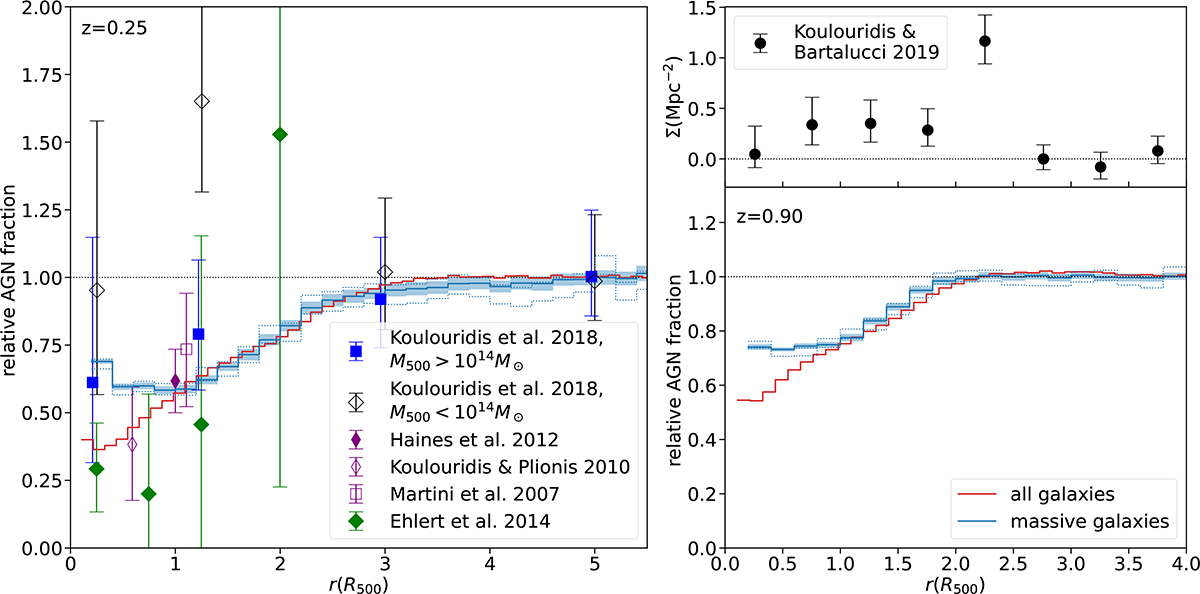
Fig. 12.
Download original image
Fraction of galaxies containing an X-ray-bright AGN, relative to the background AGN fraction, as a function of projected clustercentric distance r. Magneticum results are shown at low redshift (left panel) and high redshift (bottom right panel) for all galaxies with log M*(M⊙) > 10.15 (in red) and only massive galaxies (log M*(M⊙) > 11, in blue). The projection depth is 7.6 Mpc. The plot represents the mean profile of many lines of sight and the coloured interval ± standard deviation of different lines of sight. Dotted lines mark the 68% binomial confidence interval when only one line of sight is considered. The confidence intervals of low-mass galaxies are too narrow to be meaningfully displayed. The centralmost bins, influenced by the BCGs, are omitted. The background AGN fraction is defined as the mean fraction in the annulus between 4.5 and 6 R500. The fraction at low redshift (left panel) is compared with results of Ehlert et al. (2014) and Koulouridis et al. (2018), from which we also obtained the results of Martini et al. (2007), Koulouridis & Plionis (2010) and Haines et al. (2012). In the upper right panel, we plot the quantity Σ from Fig. 1 in Koulouridis & Bartalucci (2019). The data points from the literature are placed at the centre of radial bins and are shown without the radial errorbars.
Current usage metrics show cumulative count of Article Views (full-text article views including HTML views, PDF and ePub downloads, according to the available data) and Abstracts Views on Vision4Press platform.
Data correspond to usage on the plateform after 2015. The current usage metrics is available 48-96 hours after online publication and is updated daily on week days.
Initial download of the metrics may take a while.