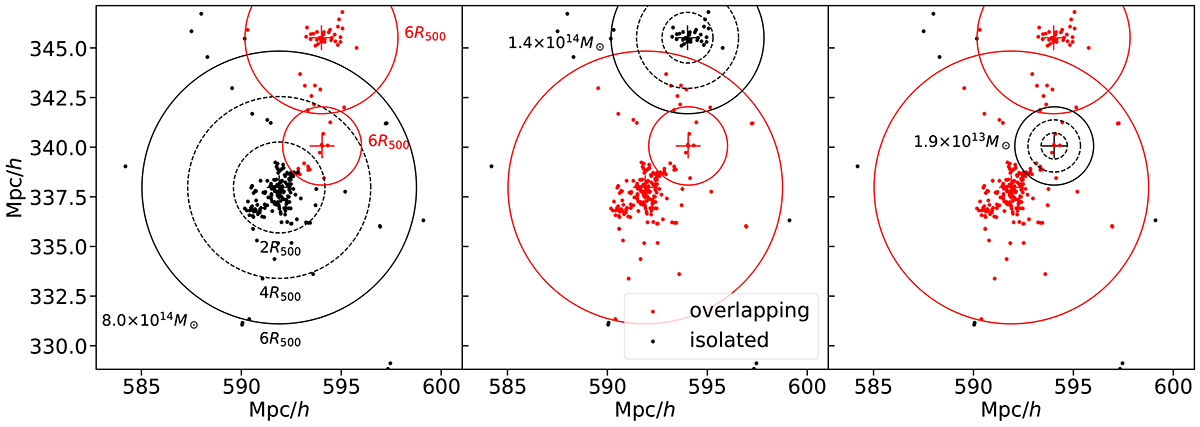
Fig. 1.
Download original image
Region of 18 × 18 × 2 comoving Mpc h−1 at redshift 0.25 containing three clusters. Dots represent the comoving positions of galaxies. The different panels depict the definition of the overlapping (red) and the isolated (black) regions in each cluster, marked with black circles that represent its 2 R500, 4 R500, and 6 R500. Red circles represent rov = 6 R500 of the neighbouring clusters, and the crosses mark the cluster centres. Mass M500 of the considered cluster is displayed in each panel.
Current usage metrics show cumulative count of Article Views (full-text article views including HTML views, PDF and ePub downloads, according to the available data) and Abstracts Views on Vision4Press platform.
Data correspond to usage on the plateform after 2015. The current usage metrics is available 48-96 hours after online publication and is updated daily on week days.
Initial download of the metrics may take a while.