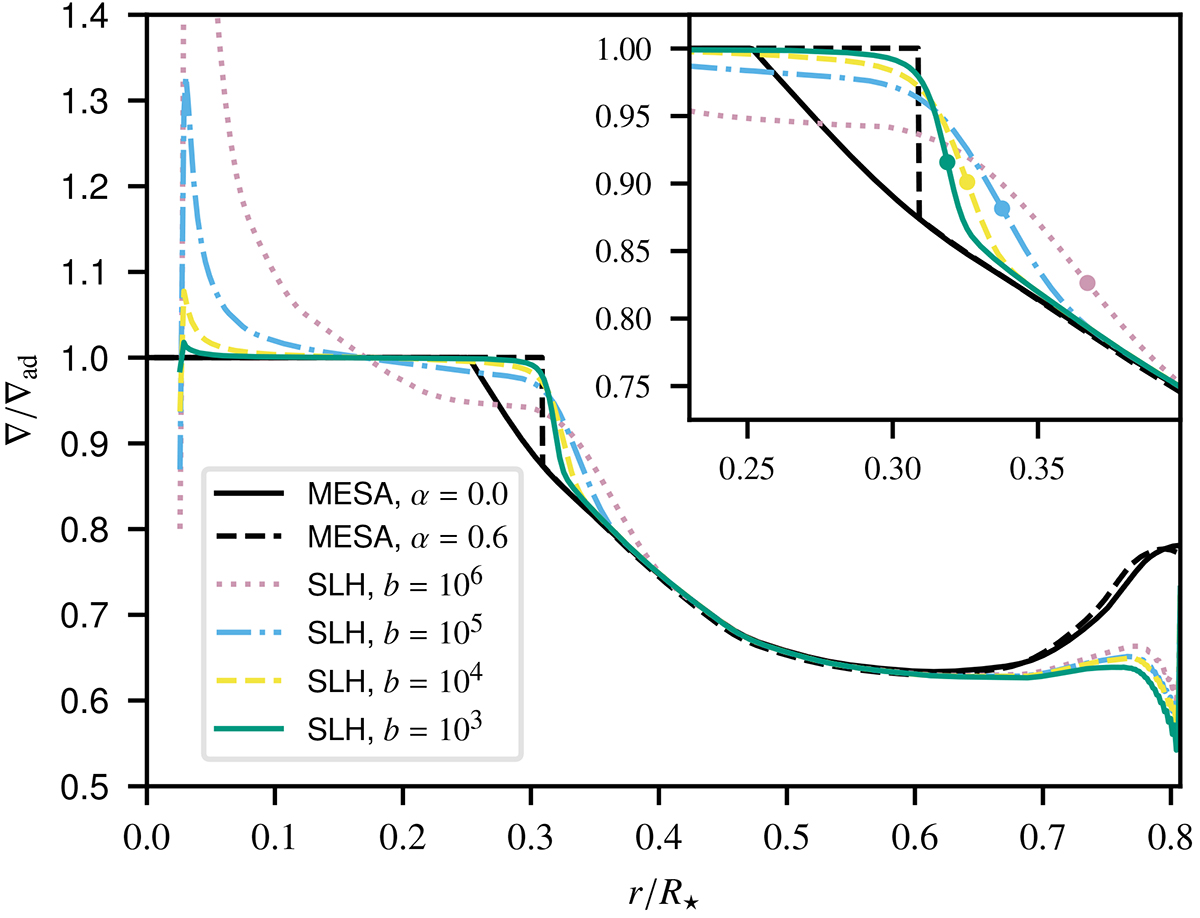
Fig. 9.
Download original image
Radial profiles of the temperature gradient ∇ in 2.5D simulations with Nr = 512 and the boost factors given in the legend. The gradients are normalised using the adiabatic temperature gradient ∇ad. The curves are derived from simulation data averaged over the time interval 0.3τth ≤ t ≤ τth except for the b = 103 simulation, for which we use the interval 0.3τth ≤ t ≤ 0.5τth. MESA models with α = 0.0 (our initial condition) and α = 0.6 are shown for comparison. The inset zooms in onto the convective-penetration layer with dots marking the location of the steepest gradient in ∇/∇ad.
Current usage metrics show cumulative count of Article Views (full-text article views including HTML views, PDF and ePub downloads, according to the available data) and Abstracts Views on Vision4Press platform.
Data correspond to usage on the plateform after 2015. The current usage metrics is available 48-96 hours after online publication and is updated daily on week days.
Initial download of the metrics may take a while.