Fig. 7.
Download original image
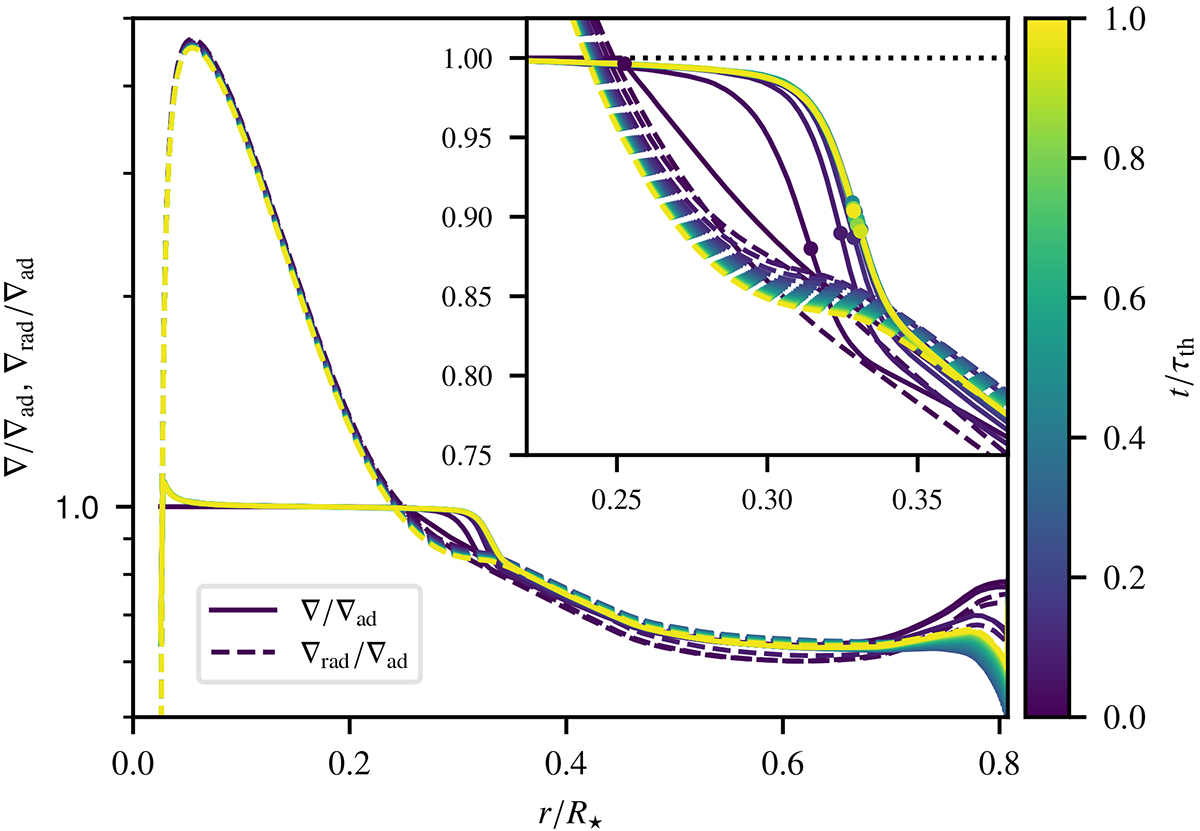
Time evolution of the radial profiles of the actual and radiative temperature gradients ∇ and ∇rad, respectively, in the 2.5D simulation with b = 104 and Nr = 1024. The gradients are normalised using the adiabatic temperature gradient ∇ad. Simulation time is given as a fraction of the thermal timescale τth on the colour bar. Each curve, except for that showing the initial condition, corresponds to a time average over 0.05τth. The inset zooms in onto the convective-penetration layer with dots marking the location of the steepest gradient in ∇/∇ad.
Current usage metrics show cumulative count of Article Views (full-text article views including HTML views, PDF and ePub downloads, according to the available data) and Abstracts Views on Vision4Press platform.
Data correspond to usage on the plateform after 2015. The current usage metrics is available 48-96 hours after online publication and is updated daily on week days.
Initial download of the metrics may take a while.