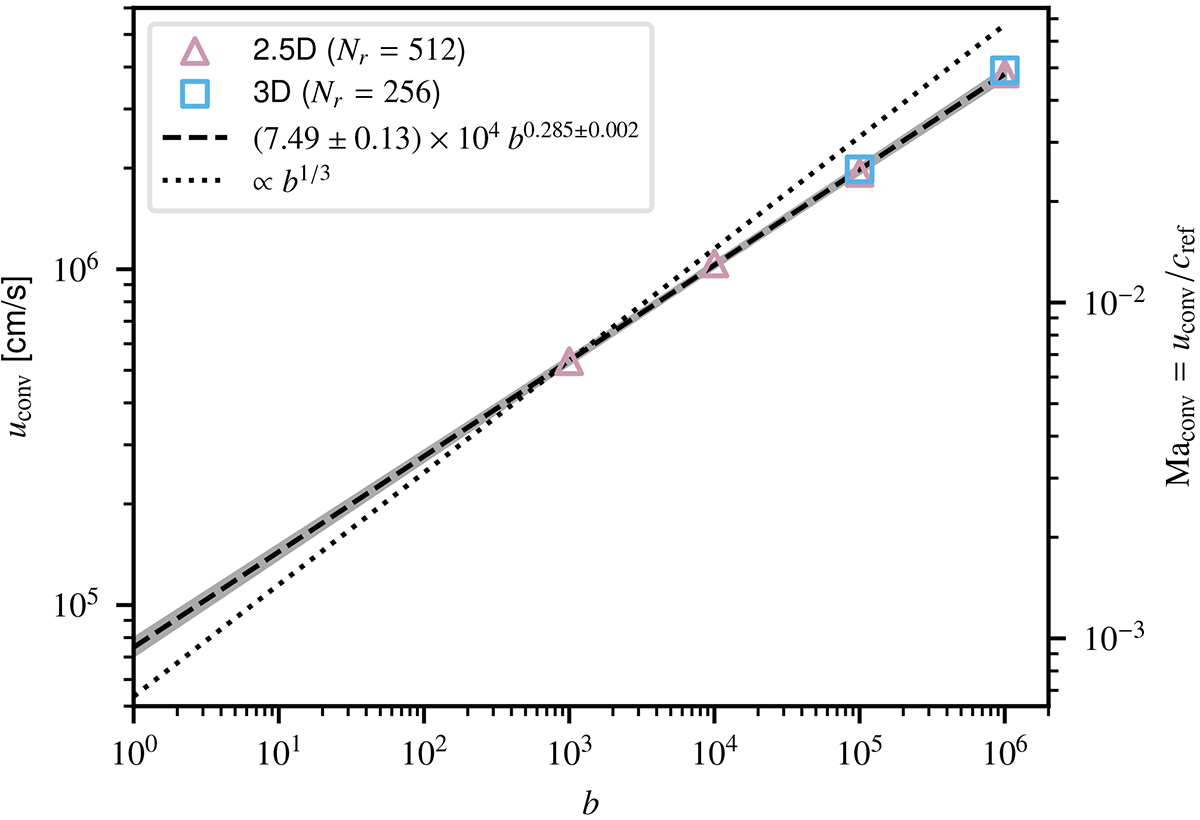
Fig. 6.
Download original image
Dependence of the convective velocity uconv on the boost factor b. The right vertical axis shows the corresponding Mach numbers computed using the reference sound speed cref = 7.96 × 107 cm s−1. Statistical-variation ranges for the individual data points are smaller than the markers and not shown. A straight line is fitted to the 2.5D data points using the Monte-Carlo procedure described in Sect. 3.2. The grey shading shows the 3σ statistical-variation interval around the mean fit. Parameters of the scaling law are given in the legend. The usual adiabatic scaling uconv ∝ b1/3 is also shown for comparison.
Current usage metrics show cumulative count of Article Views (full-text article views including HTML views, PDF and ePub downloads, according to the available data) and Abstracts Views on Vision4Press platform.
Data correspond to usage on the plateform after 2015. The current usage metrics is available 48-96 hours after online publication and is updated daily on week days.
Initial download of the metrics may take a while.