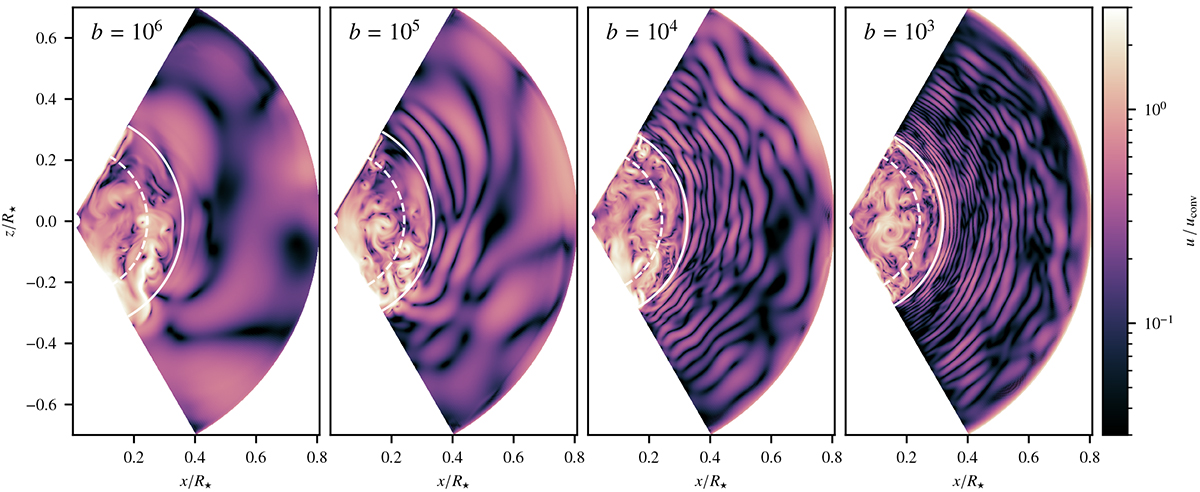
Fig. 3.
Download original image
Velocity fields in 2.5D simulations with boost factors b ∈ (106, 105, 104, 103) performed on the 512 × 256 grid. The velocity is normalised using the typical convective velocity uconv as given by the scaling law shown in Fig. 6. The dashed and solid lines give the time-averaged radii of the Schwarzschild and convective boundaries, respectively. The simulations are shown at t = 0.5τth(b).
Current usage metrics show cumulative count of Article Views (full-text article views including HTML views, PDF and ePub downloads, according to the available data) and Abstracts Views on Vision4Press platform.
Data correspond to usage on the plateform after 2015. The current usage metrics is available 48-96 hours after online publication and is updated daily on week days.
Initial download of the metrics may take a while.