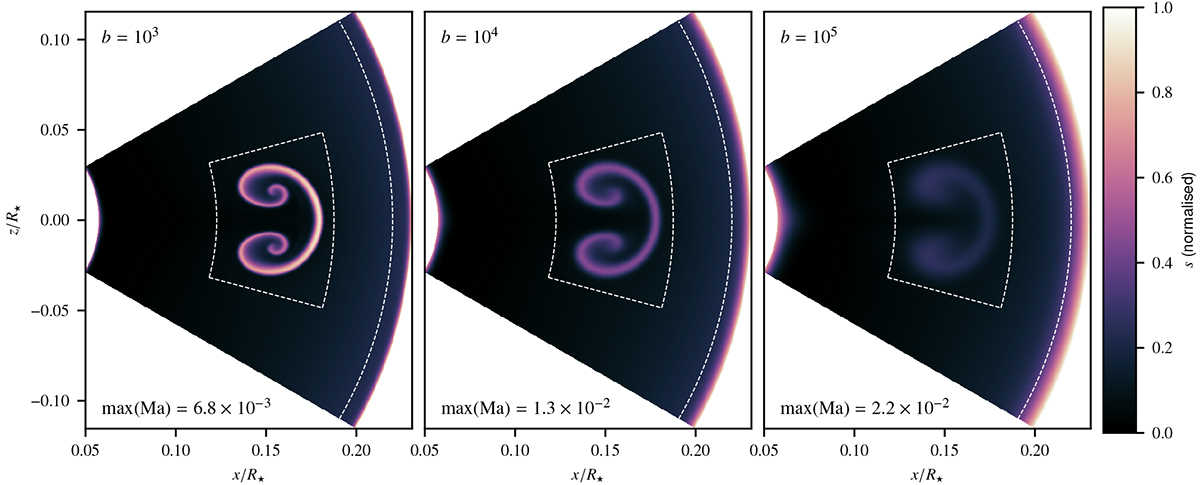
Fig. B.5.
Download original image
Reference solutions to the hot-bubble problem with three different boost factors b in terms of the specific entropy s normalised to range from 0 to 1. The solutions were computed a 2.5D grid of 2048 × 2048 cells. The ‘bubble’ and ‘boundary’ subdomains, in which we compute the L1 errors shown in Fig. B.6, are marked using the white dashes lines.
Current usage metrics show cumulative count of Article Views (full-text article views including HTML views, PDF and ePub downloads, according to the available data) and Abstracts Views on Vision4Press platform.
Data correspond to usage on the plateform after 2015. The current usage metrics is available 48-96 hours after online publication and is updated daily on week days.
Initial download of the metrics may take a while.