Open Access
Fig. 11.
Download original image
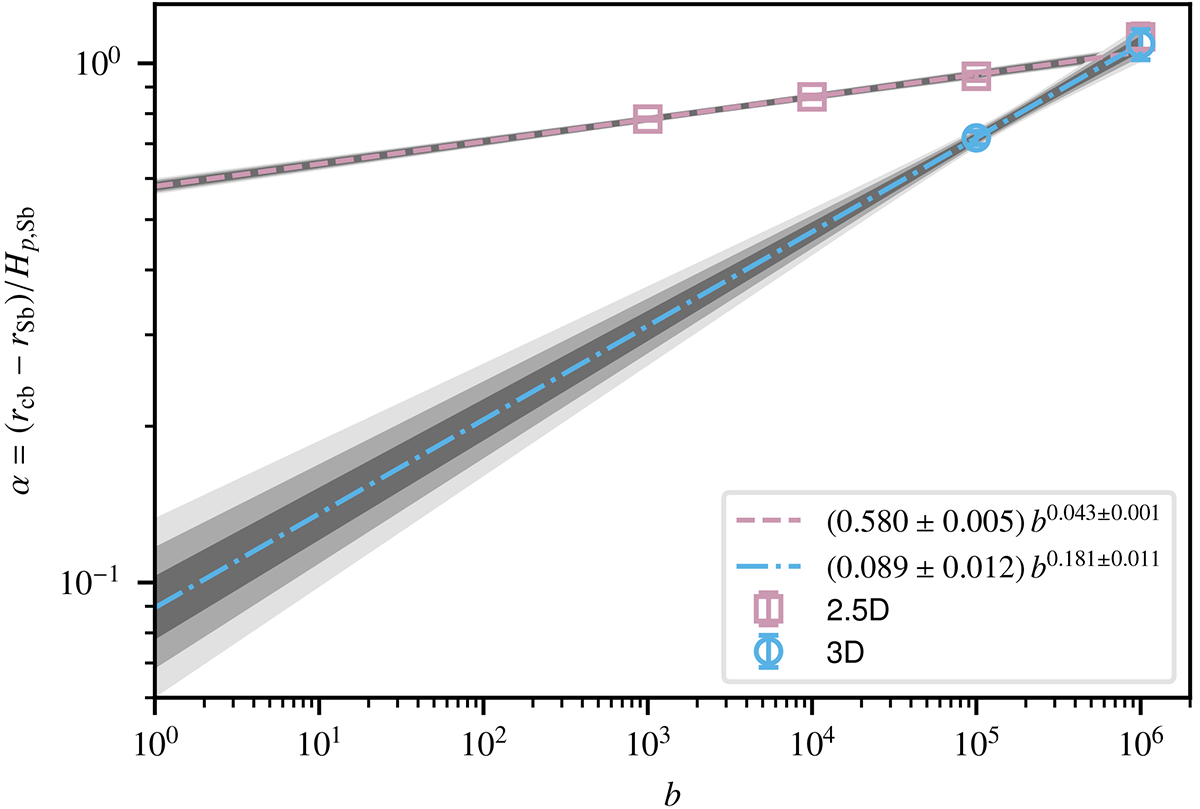
Penetration distance α extrapolated to an infinitely fine grid (see Fig. 10) as a function of the boost factor b. Assumed power-law dependencies α(b) are fitted to the 2.5D and 3D data points separately. The grey shading shows σ, 2σ, and 3σ statistical-variation intervals of the fits.
Current usage metrics show cumulative count of Article Views (full-text article views including HTML views, PDF and ePub downloads, according to the available data) and Abstracts Views on Vision4Press platform.
Data correspond to usage on the plateform after 2015. The current usage metrics is available 48-96 hours after online publication and is updated daily on week days.
Initial download of the metrics may take a while.