Fig. 10.
Download original image
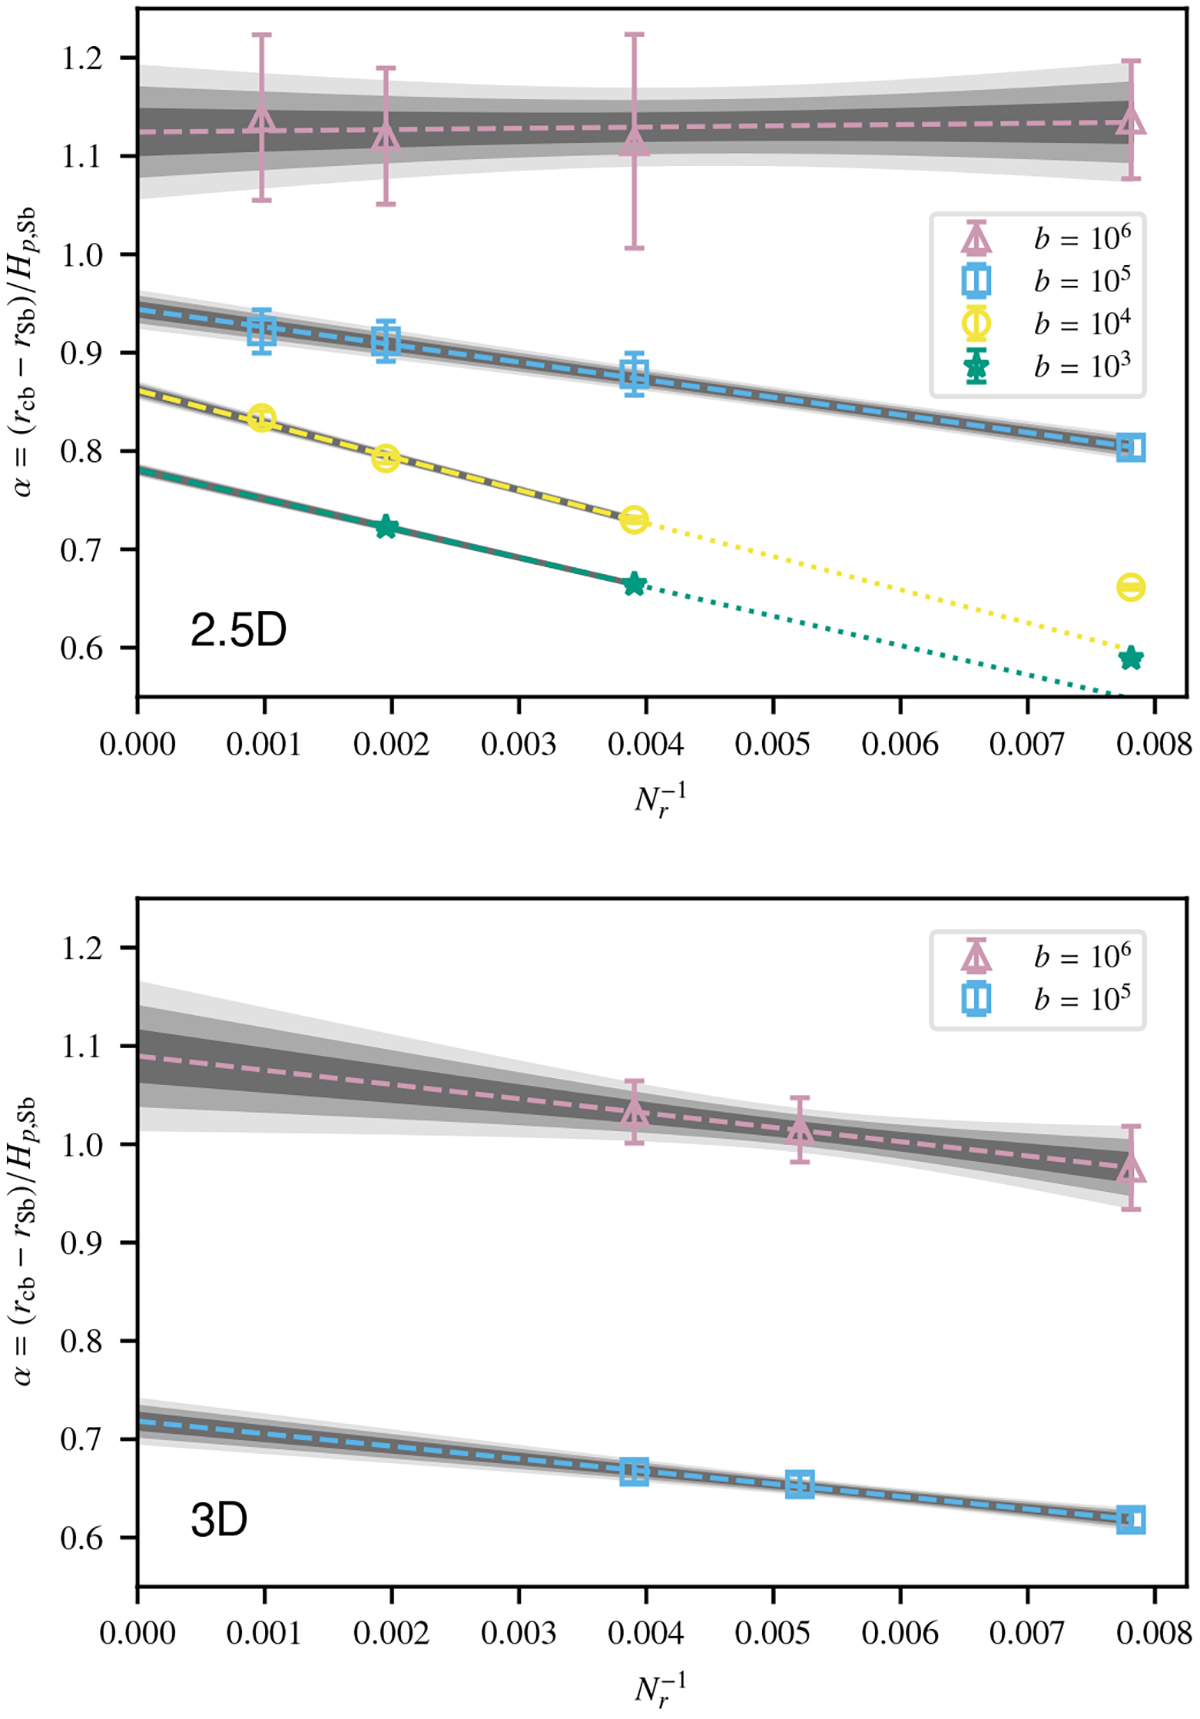
Numerical convergence of the penetration distance α for 2.5D and 3D simulations with different boost factors b. The radial grid spacing is expressed as the inverse number of radial grid cells, ![]() , so that first-order convergence corresponds to a straight line. The error bars indicate 3σ intervals of statistical variation. The grey shading shows σ, 2σ, and 3σ statistical-variation intervals of the fits. The dashed lines show the mean fit in each case and the dotted lines extrapolate the fits towards data points excluded from the fitting procedure.
, so that first-order convergence corresponds to a straight line. The error bars indicate 3σ intervals of statistical variation. The grey shading shows σ, 2σ, and 3σ statistical-variation intervals of the fits. The dashed lines show the mean fit in each case and the dotted lines extrapolate the fits towards data points excluded from the fitting procedure.
Current usage metrics show cumulative count of Article Views (full-text article views including HTML views, PDF and ePub downloads, according to the available data) and Abstracts Views on Vision4Press platform.
Data correspond to usage on the plateform after 2015. The current usage metrics is available 48-96 hours after online publication and is updated daily on week days.
Initial download of the metrics may take a while.