Open Access
Fig. 8.
Download original image
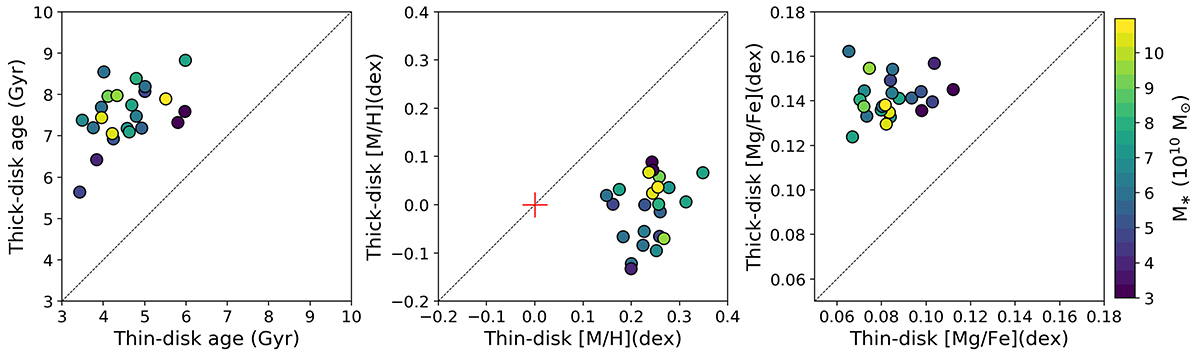
Thick-disk versus thin-disk stellar-population properties. From left to right: age, [M/H], and [Mg/Fe] abundance. Points are color coded according to the total mass of the galaxy (Table 1). The one-to-one line is indicated in black and dashed, in each panel. A red “+” symbol indicates solar metallicity in the middle panel.
Current usage metrics show cumulative count of Article Views (full-text article views including HTML views, PDF and ePub downloads, according to the available data) and Abstracts Views on Vision4Press platform.
Data correspond to usage on the plateform after 2015. The current usage metrics is available 48-96 hours after online publication and is updated daily on week days.
Initial download of the metrics may take a while.