Fig. B.2.
Download original image
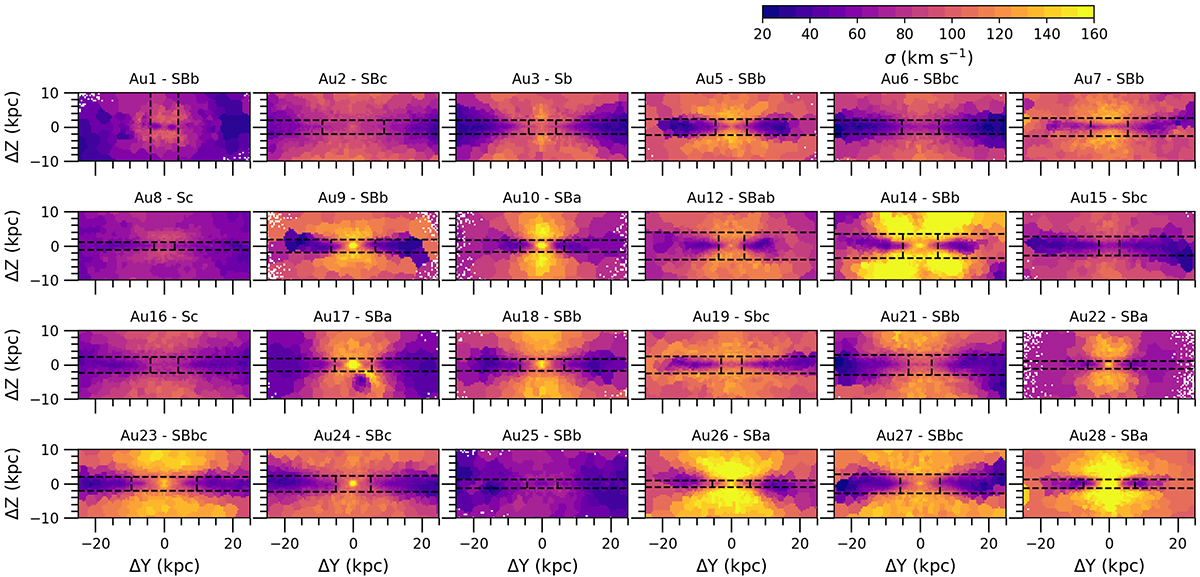
Velocity-dispersion (σ) maps of the 24 galaxies in our sample, seen edge on. For display purposes, we show a central area of the same 50 kpc × 20 kpc size for all galaxies. Horizontal dashed black lines indicate the regions where the thin disk (within the two lines) and the thick disk dominate (above and below the region between the two lines). Vertical dashed black lines enclose the central region dominated by a bar or a classical bulge. Hubble types from Table 1 are indicated on top of each panel. Pixels of 0.5 kpc × 0.5 kpc size, Voronoi binned to a target number of particles of 900 star particles per bin, were used to plot these maps.
Current usage metrics show cumulative count of Article Views (full-text article views including HTML views, PDF and ePub downloads, according to the available data) and Abstracts Views on Vision4Press platform.
Data correspond to usage on the plateform after 2015. The current usage metrics is available 48-96 hours after online publication and is updated daily on week days.
Initial download of the metrics may take a while.