Fig. 10.
Download original image
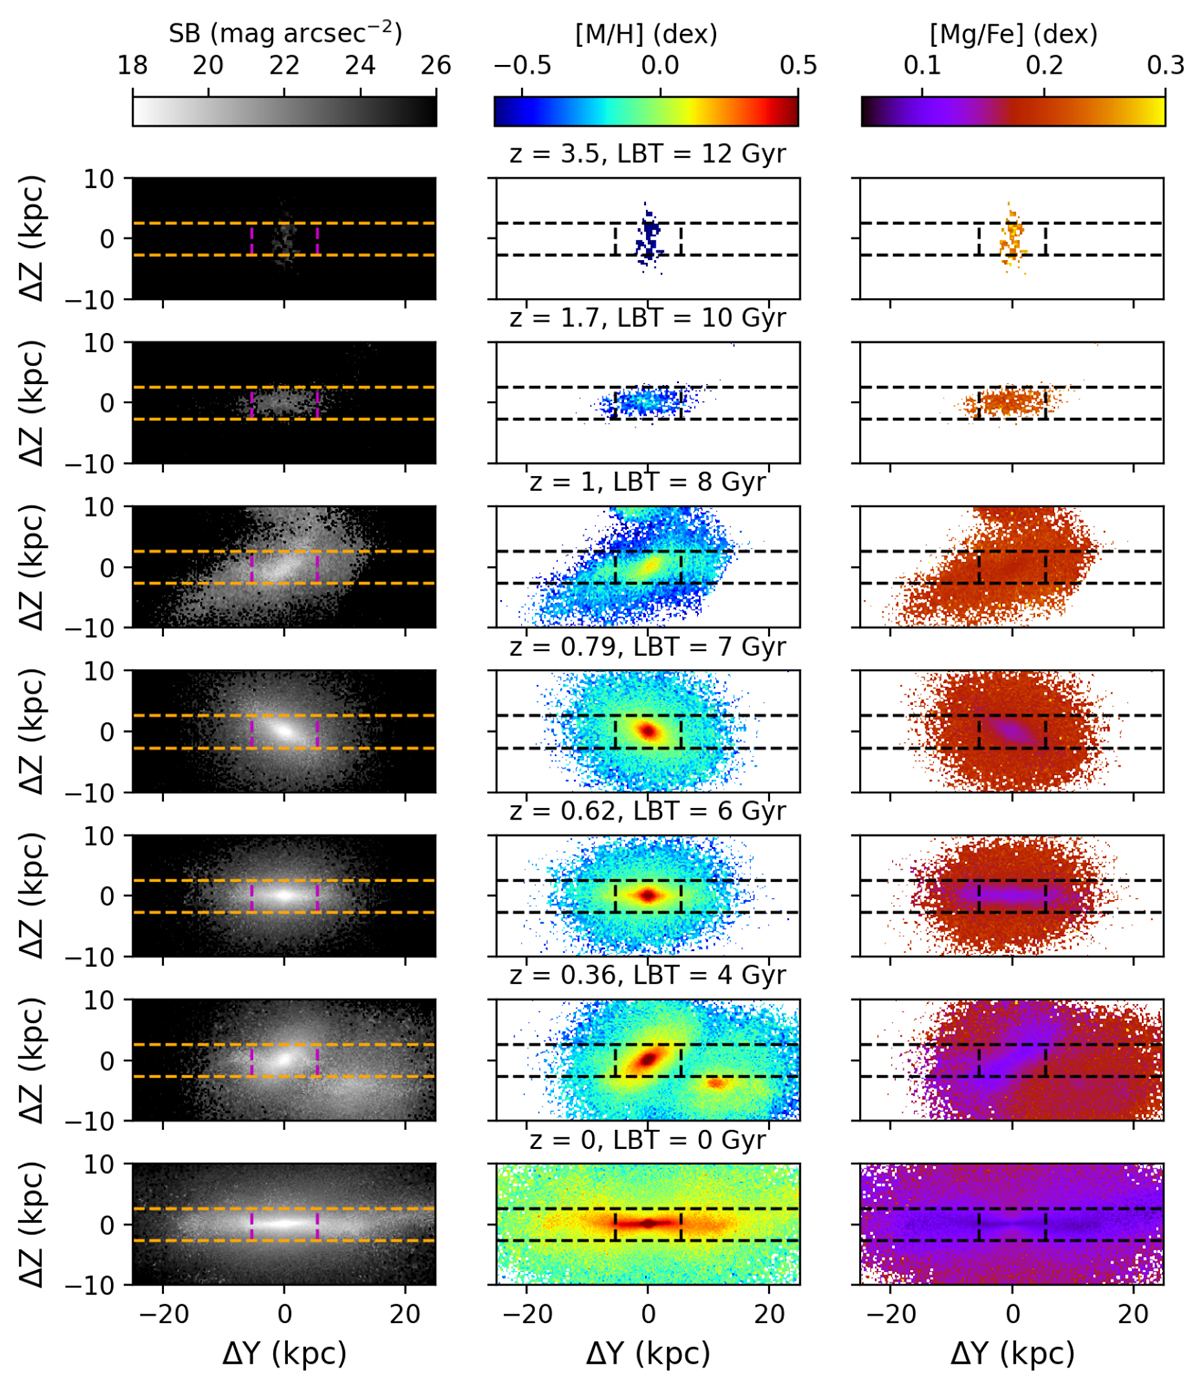
Time evolution of the galaxy Au7 seen edge on. Surface brightness is shown in the left column, total metallicity [M/H] in the middle column, and [Mg/Fe] abundance in the right column. From top to bottom, the stellar component is shown for seven different snapshots. On top of the middle panels, the redshift and the look-back time (LBT) corresponding to the snapshot shown in that row are indicated. For comparison, horizontal dashed lines separate the regions where the thin or the thick disks dominate at z = 0, while the vertical lines indicate the region where the central component (bar or classical bulge) dominates at z = 0.
Current usage metrics show cumulative count of Article Views (full-text article views including HTML views, PDF and ePub downloads, according to the available data) and Abstracts Views on Vision4Press platform.
Data correspond to usage on the plateform after 2015. The current usage metrics is available 48-96 hours after online publication and is updated daily on week days.
Initial download of the metrics may take a while.