Fig. 5
Download original image
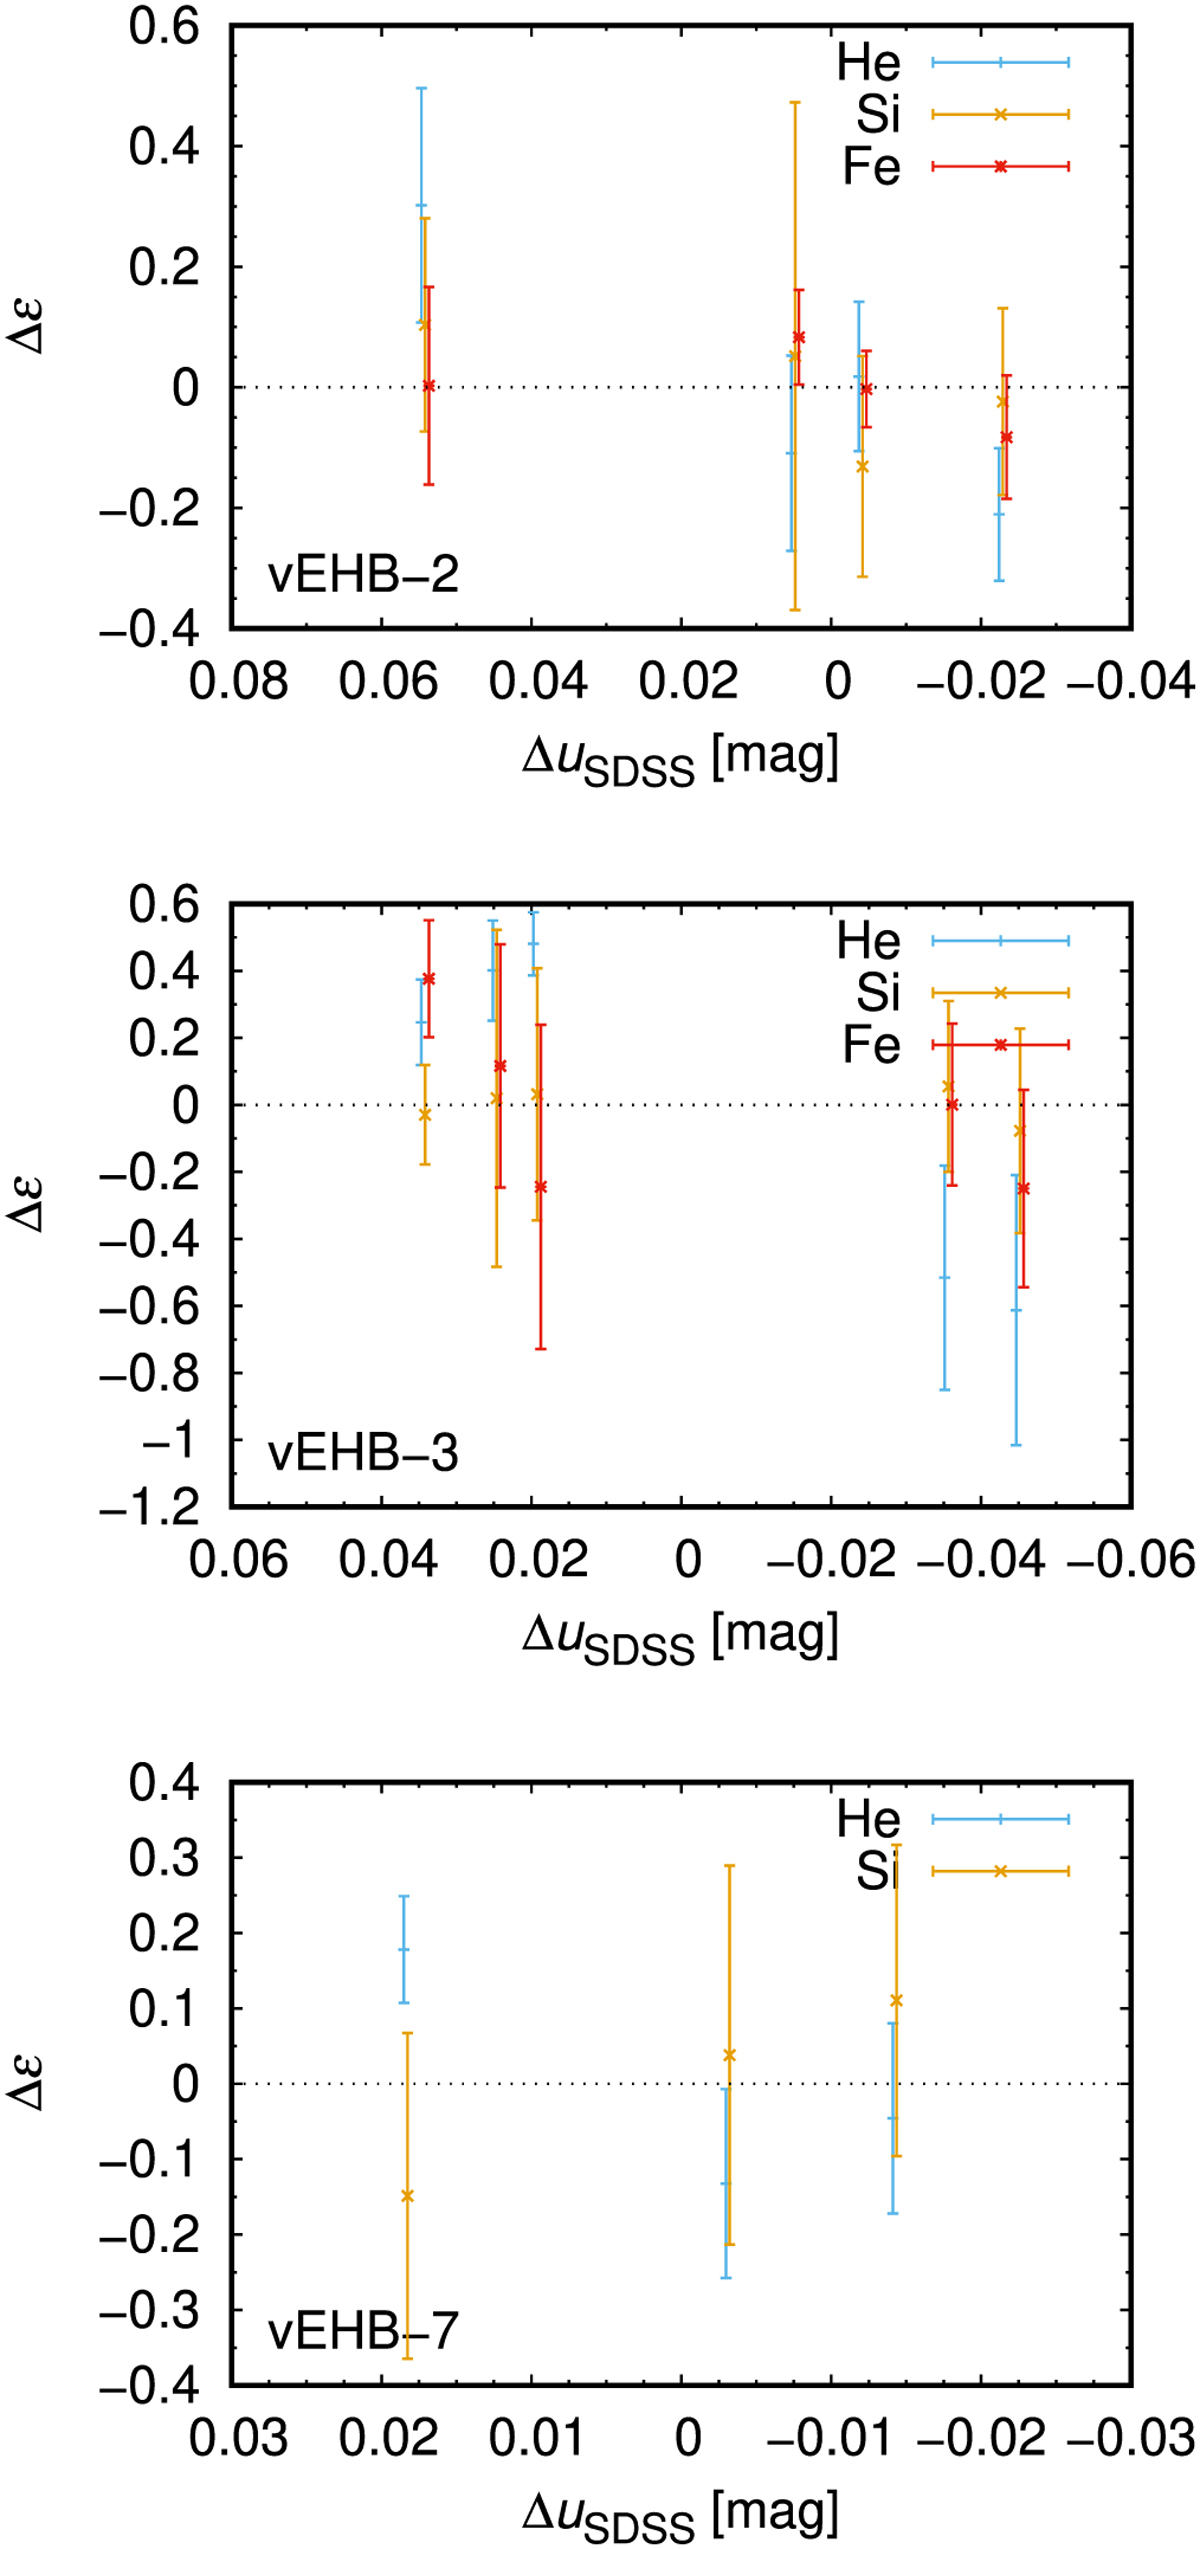
Difference between abundances of selected elements derived from individual spectra and a mean abundance. Plotted as a function of relative magnitudes for individual stars. Elements plotted in the graph typically contribute most significantly to the light variations at studied effective temperatures (Oksala et al. 2015; Krtička et al. 2020b). The individual points were shifted slightly horizontally to avoid overlapping.
Current usage metrics show cumulative count of Article Views (full-text article views including HTML views, PDF and ePub downloads, according to the available data) and Abstracts Views on Vision4Press platform.
Data correspond to usage on the plateform after 2015. The current usage metrics is available 48-96 hours after online publication and is updated daily on week days.
Initial download of the metrics may take a while.