Fig. 1
Download original image
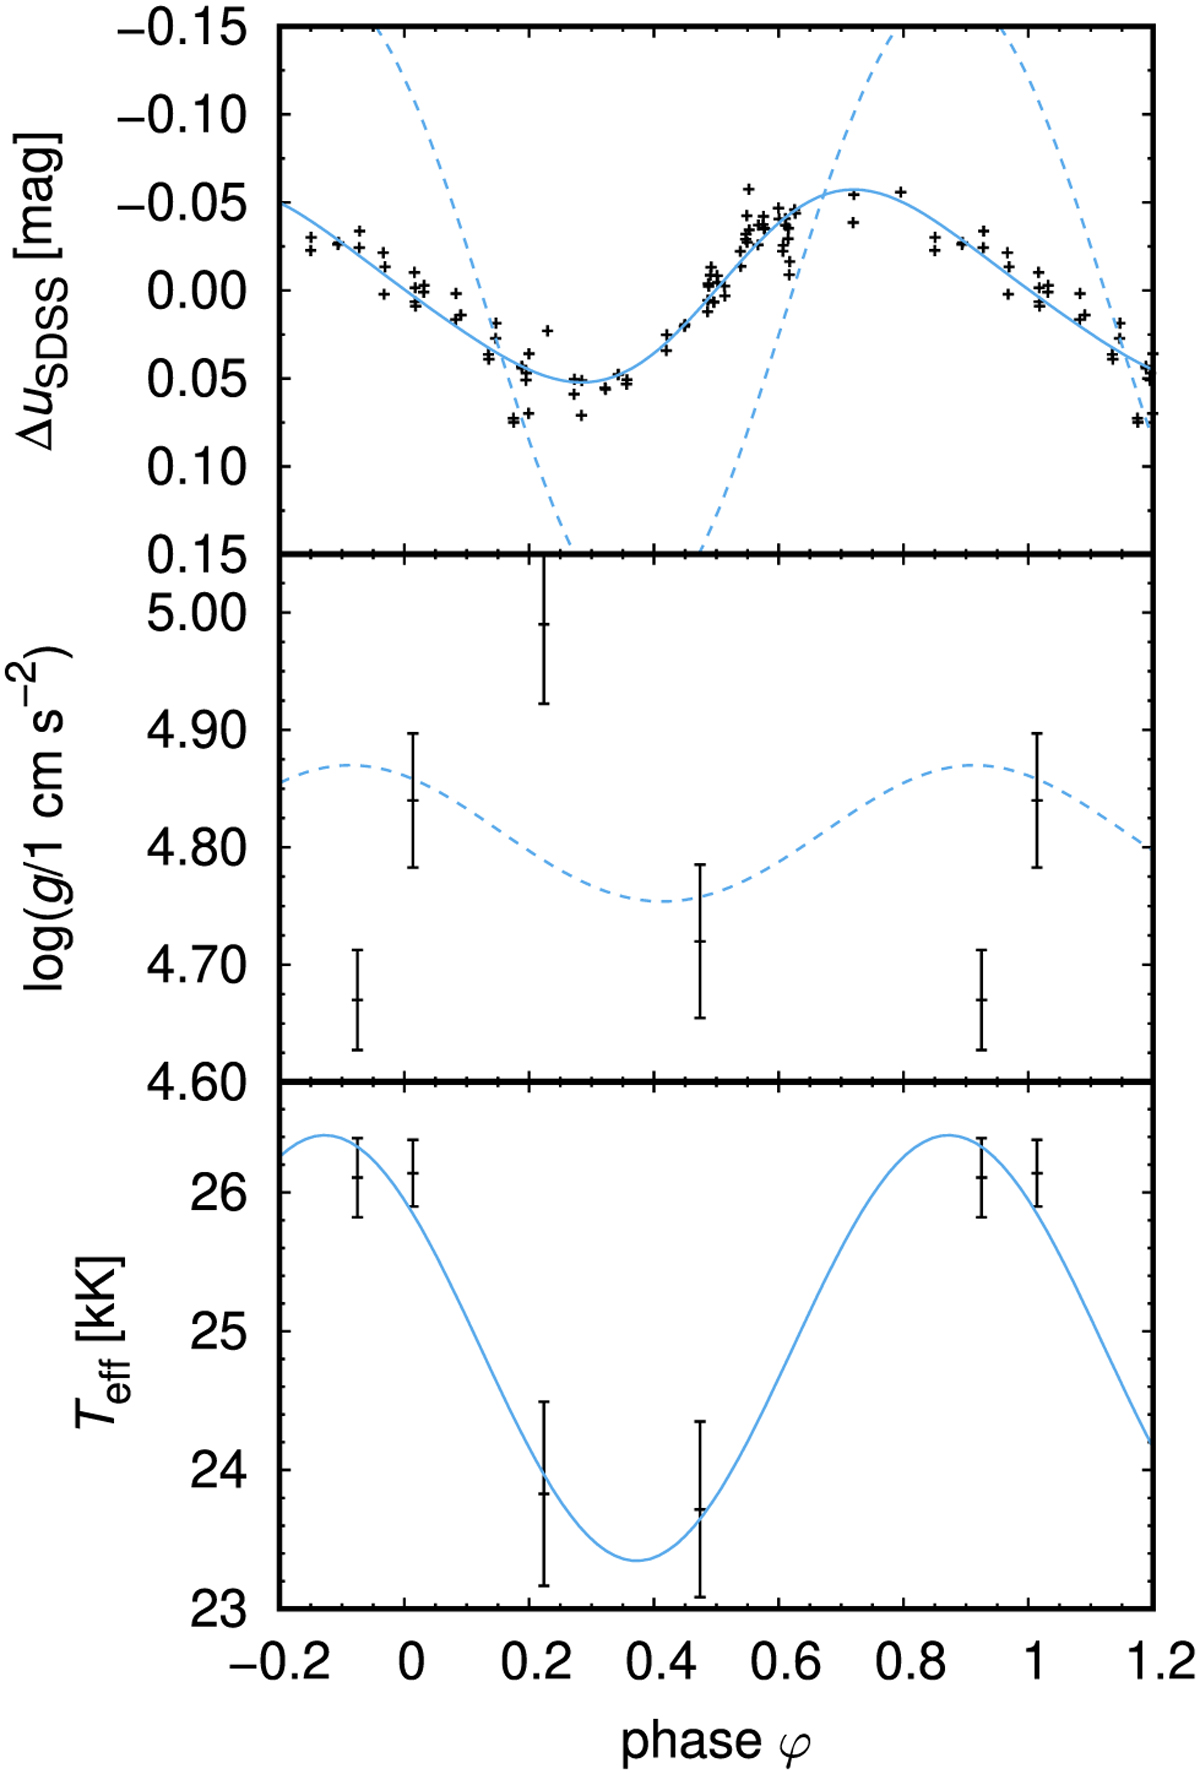
Phase variations of vEHB-2. Upper panel: observed light variations from Momany et al. (2020). Dashed blue line denotes predictions deduced purely from temperature variations, while solid line denotes a fit with additional sinusoidal radius variations. Middle panel: surface gravity variations. Dashed blue line denotes surface gravity determined from the radius variations. Lower panel: effective temperature variations. Solid blue line denotes sinusoidal fit. Part of the variations for φ < 0 and φ > 1 are repeated for better visibility.
Current usage metrics show cumulative count of Article Views (full-text article views including HTML views, PDF and ePub downloads, according to the available data) and Abstracts Views on Vision4Press platform.
Data correspond to usage on the plateform after 2015. The current usage metrics is available 48-96 hours after online publication and is updated daily on week days.
Initial download of the metrics may take a while.