Open Access
Fig. 8.
Download original image
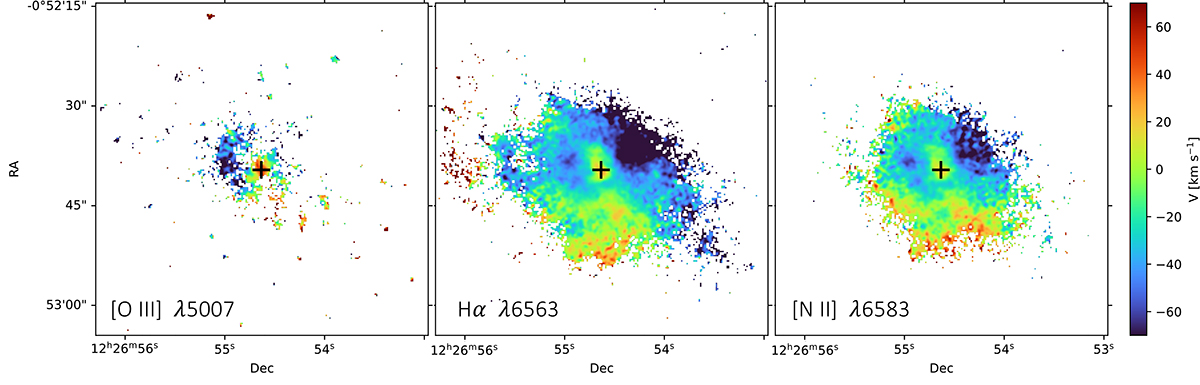
Moment-1 velocity maps of the ionised gas traced by [O III] (left), Hα (centre), and [N II]λ6583 (right). In each case, a signal-to-noise ratio cut of three has been applied. Maps have been smoothed by a σ = 1 spaxel Gaussian kernel to improve visual output.
Current usage metrics show cumulative count of Article Views (full-text article views including HTML views, PDF and ePub downloads, according to the available data) and Abstracts Views on Vision4Press platform.
Data correspond to usage on the plateform after 2015. The current usage metrics is available 48-96 hours after online publication and is updated daily on week days.
Initial download of the metrics may take a while.