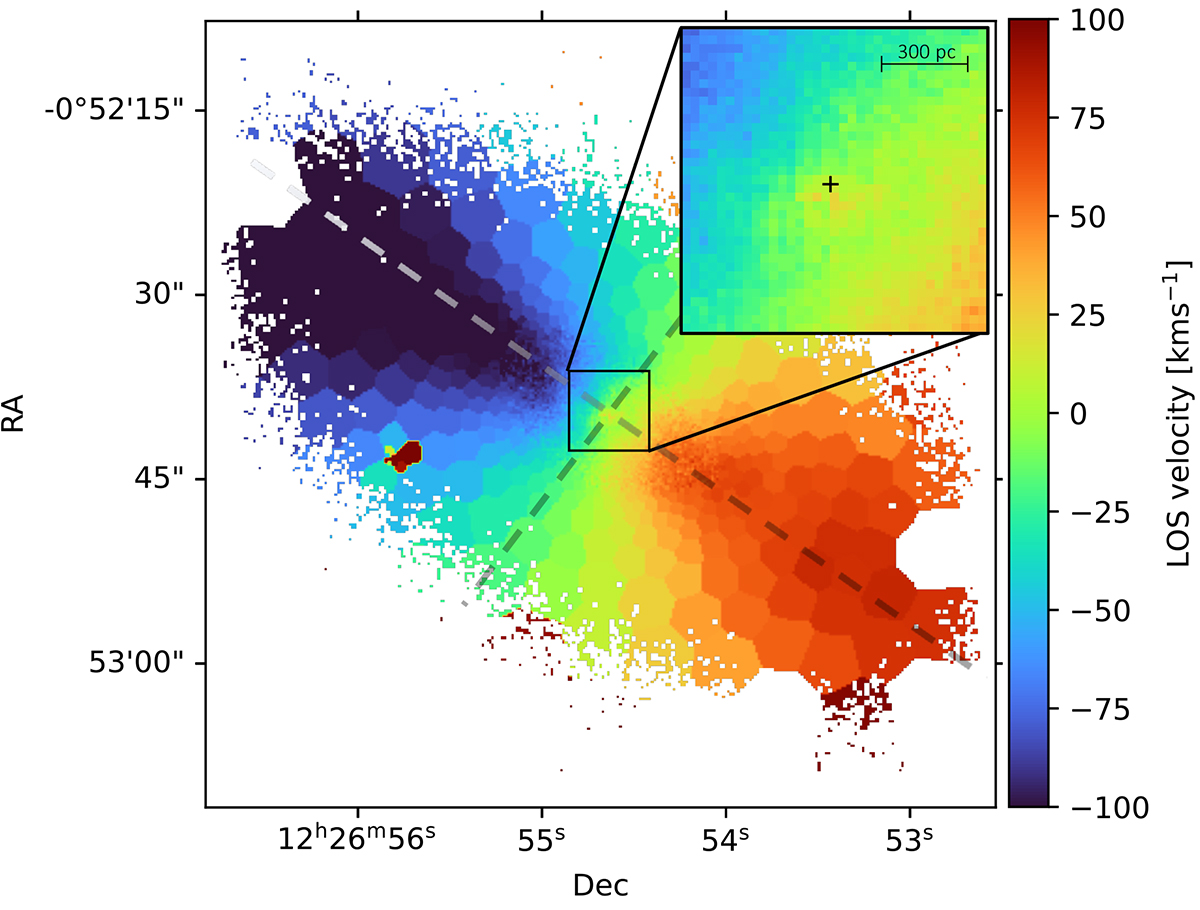
Fig. 6.
Download original image
Map of the stellar velocities derived from the pPXF fitting. The black square denotes the extent of the 7 × 7 arcsec2 zoom-in region shown in the insert. The position of the CON is marked with a black cross and dashed lines mark the positions of the major and minor axes. Pixels have been binned to achieve a signal-to-noise ratio of 20. An initial signal-to-noise ratio cut of 2 has been applied, with pixels below this threshold omitted from the binning.
Current usage metrics show cumulative count of Article Views (full-text article views including HTML views, PDF and ePub downloads, according to the available data) and Abstracts Views on Vision4Press platform.
Data correspond to usage on the plateform after 2015. The current usage metrics is available 48-96 hours after online publication and is updated daily on week days.
Initial download of the metrics may take a while.