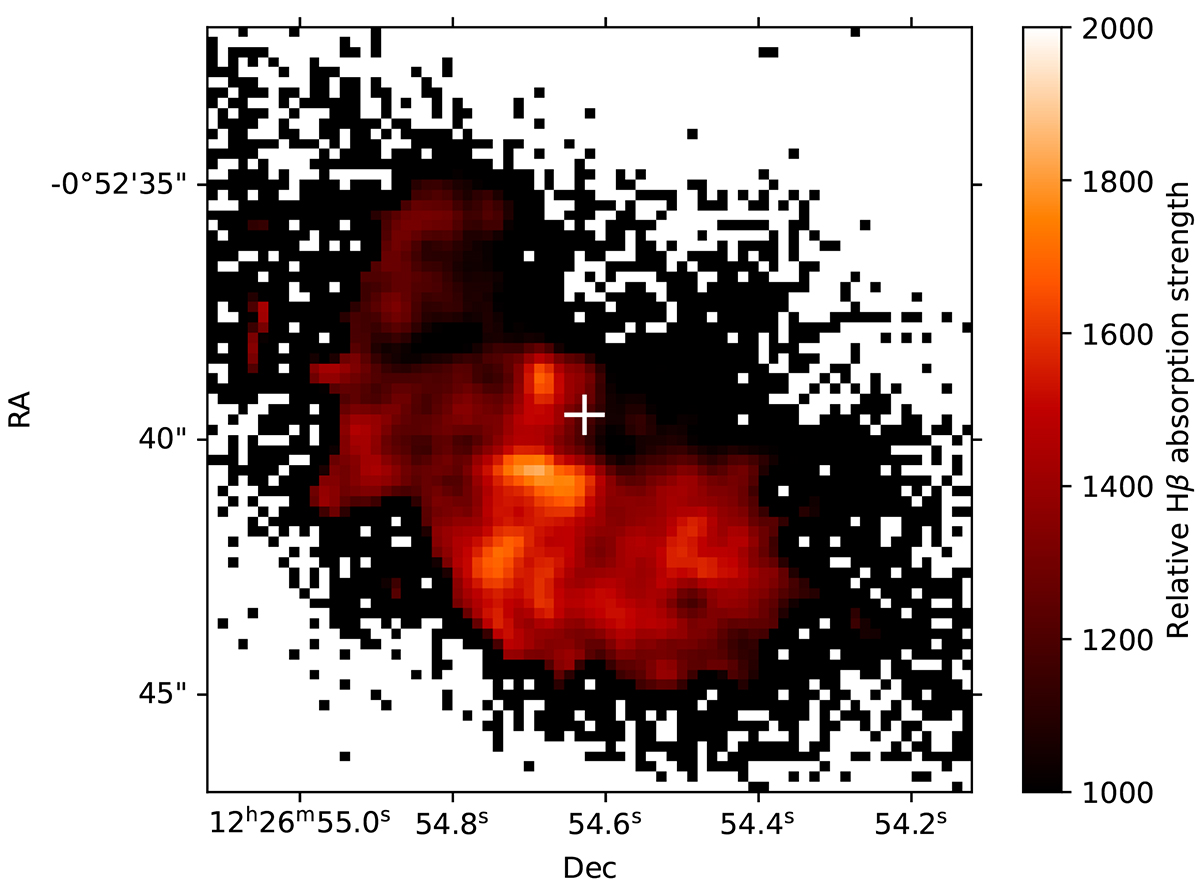
Fig. 4.
Download original image
Map of Hβ absorption strength, normalised to the continuum level in each individual spaxel. A 3σ S/N cut has been applied and the image has been smoothed by a 1σ Gaussian kernel to improve visual output. Colours have been inverted such that stronger absorption corresponds to brighter regions on the map. White cross denotes the location of the CON.
Current usage metrics show cumulative count of Article Views (full-text article views including HTML views, PDF and ePub downloads, according to the available data) and Abstracts Views on Vision4Press platform.
Data correspond to usage on the plateform after 2015. The current usage metrics is available 48-96 hours after online publication and is updated daily on week days.
Initial download of the metrics may take a while.