Fig. 14.
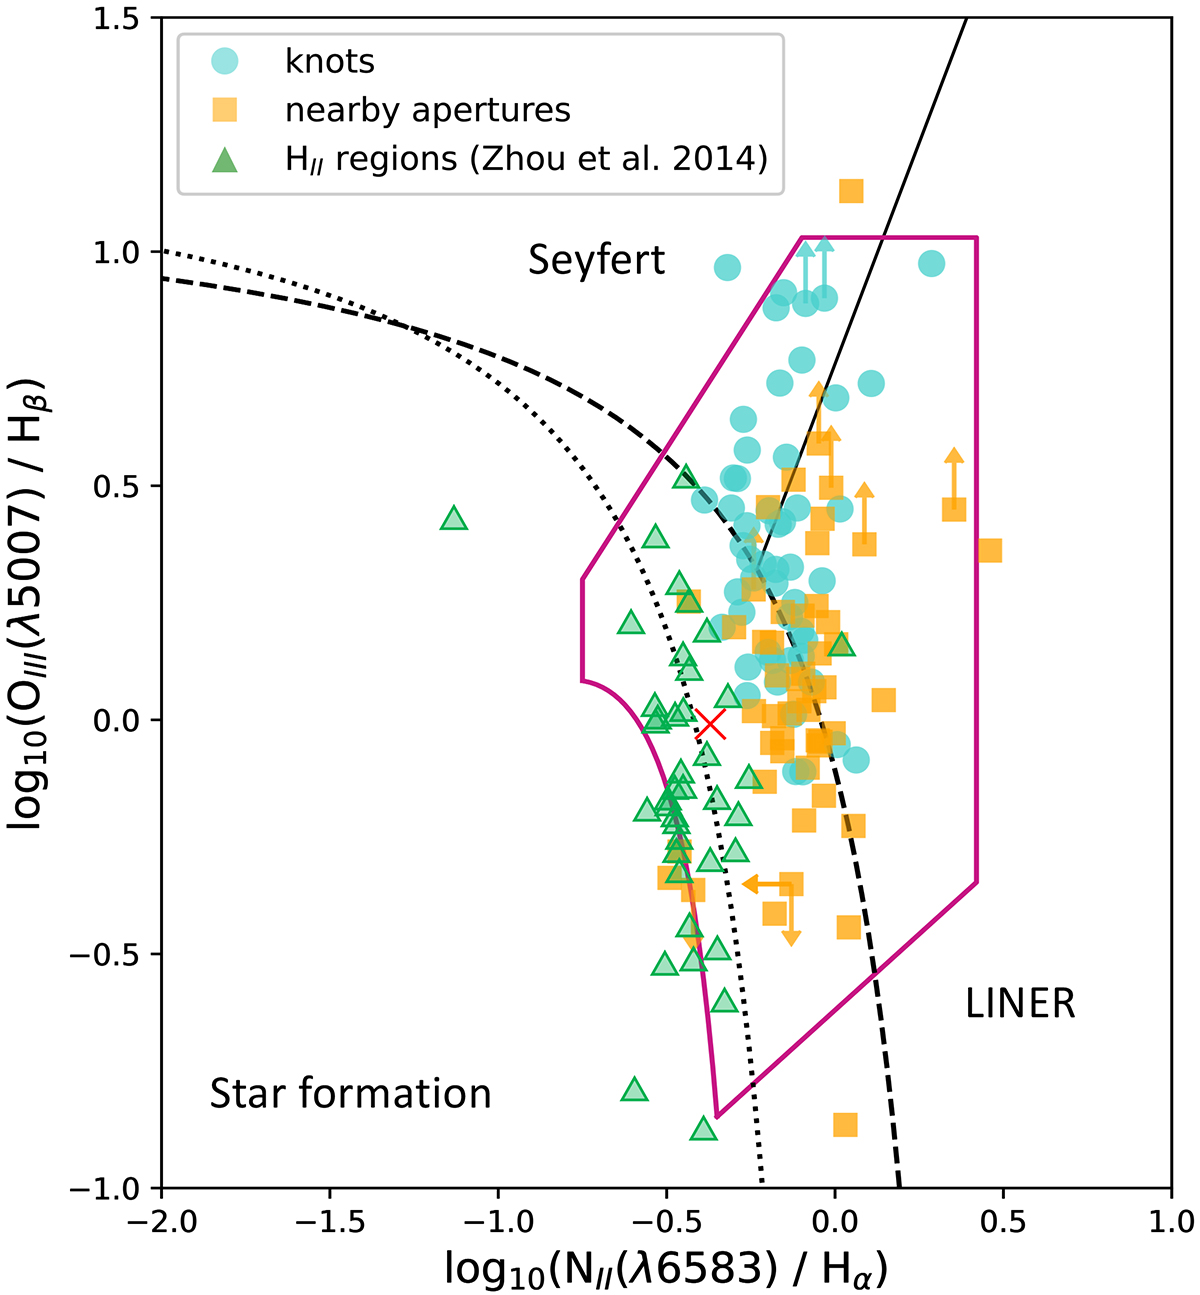
Download original image
BPT diagram showing the dominant ionising source of the knots (blue circles) and nearby regions (yellow squares) compared to a sample of known H II regions in the nearby LIRG Arp 86 from Zhou et al. (2014; green triangles), based on the diagnostic models of Kauffmann et al. (2003; dotted line), Kewley et al. (2001; dashed line), and Kewley et al. (2006; solid line). The region of the diagram consistent with shock heating (Alatalo et al. 2016) is overlaid (pink). Red cross marks the position of the central spaxel denoting the position of the CON in NGC 4418.
Current usage metrics show cumulative count of Article Views (full-text article views including HTML views, PDF and ePub downloads, according to the available data) and Abstracts Views on Vision4Press platform.
Data correspond to usage on the plateform after 2015. The current usage metrics is available 48-96 hours after online publication and is updated daily on week days.
Initial download of the metrics may take a while.