Fig. 13.
Download original image
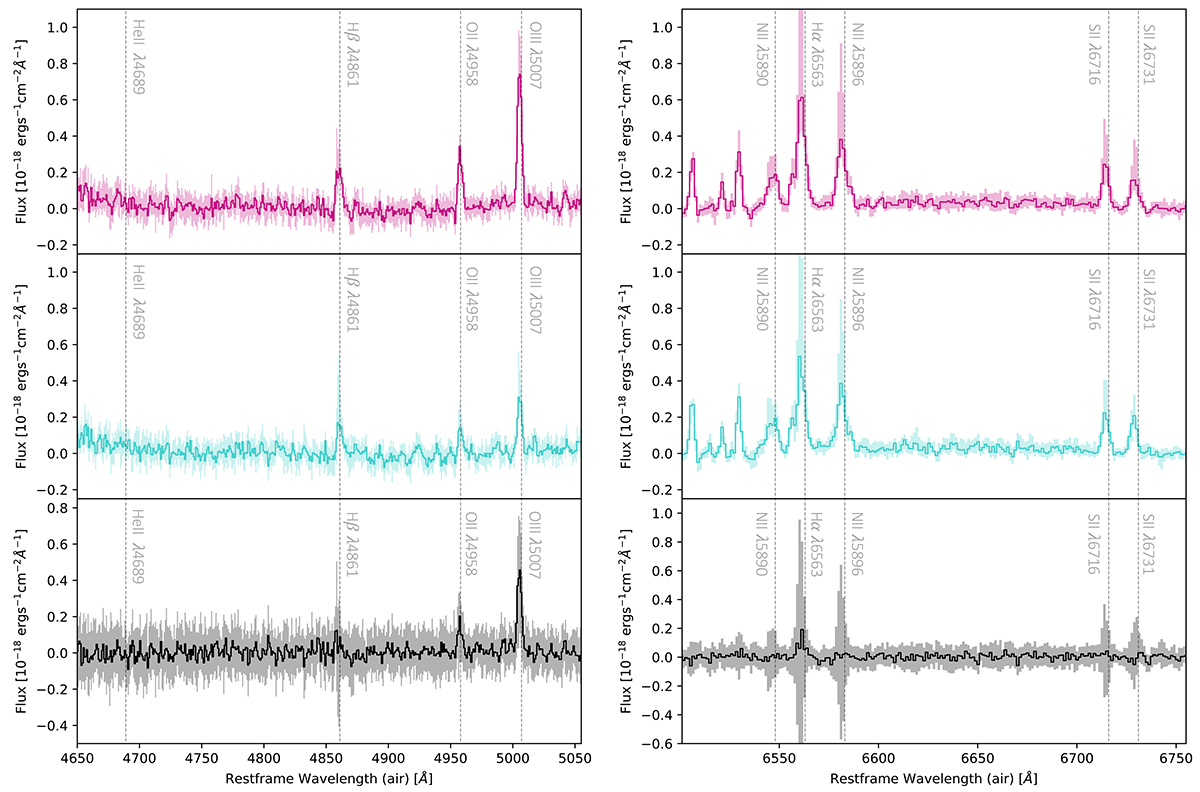
Average spectrum of the [O III] knots compared to nearby regions of the galaxy. Upper: mean spectrum for the [O III] knots (pink). Middle: average spectrum of nearby regions of the galaxy (blue). Lower: knot minus nearby region residual spectrum. Shaded regions denote the 32nd and 68th percentiles of the spectra in each case.
Current usage metrics show cumulative count of Article Views (full-text article views including HTML views, PDF and ePub downloads, according to the available data) and Abstracts Views on Vision4Press platform.
Data correspond to usage on the plateform after 2015. The current usage metrics is available 48-96 hours after online publication and is updated daily on week days.
Initial download of the metrics may take a while.