Fig. 10.
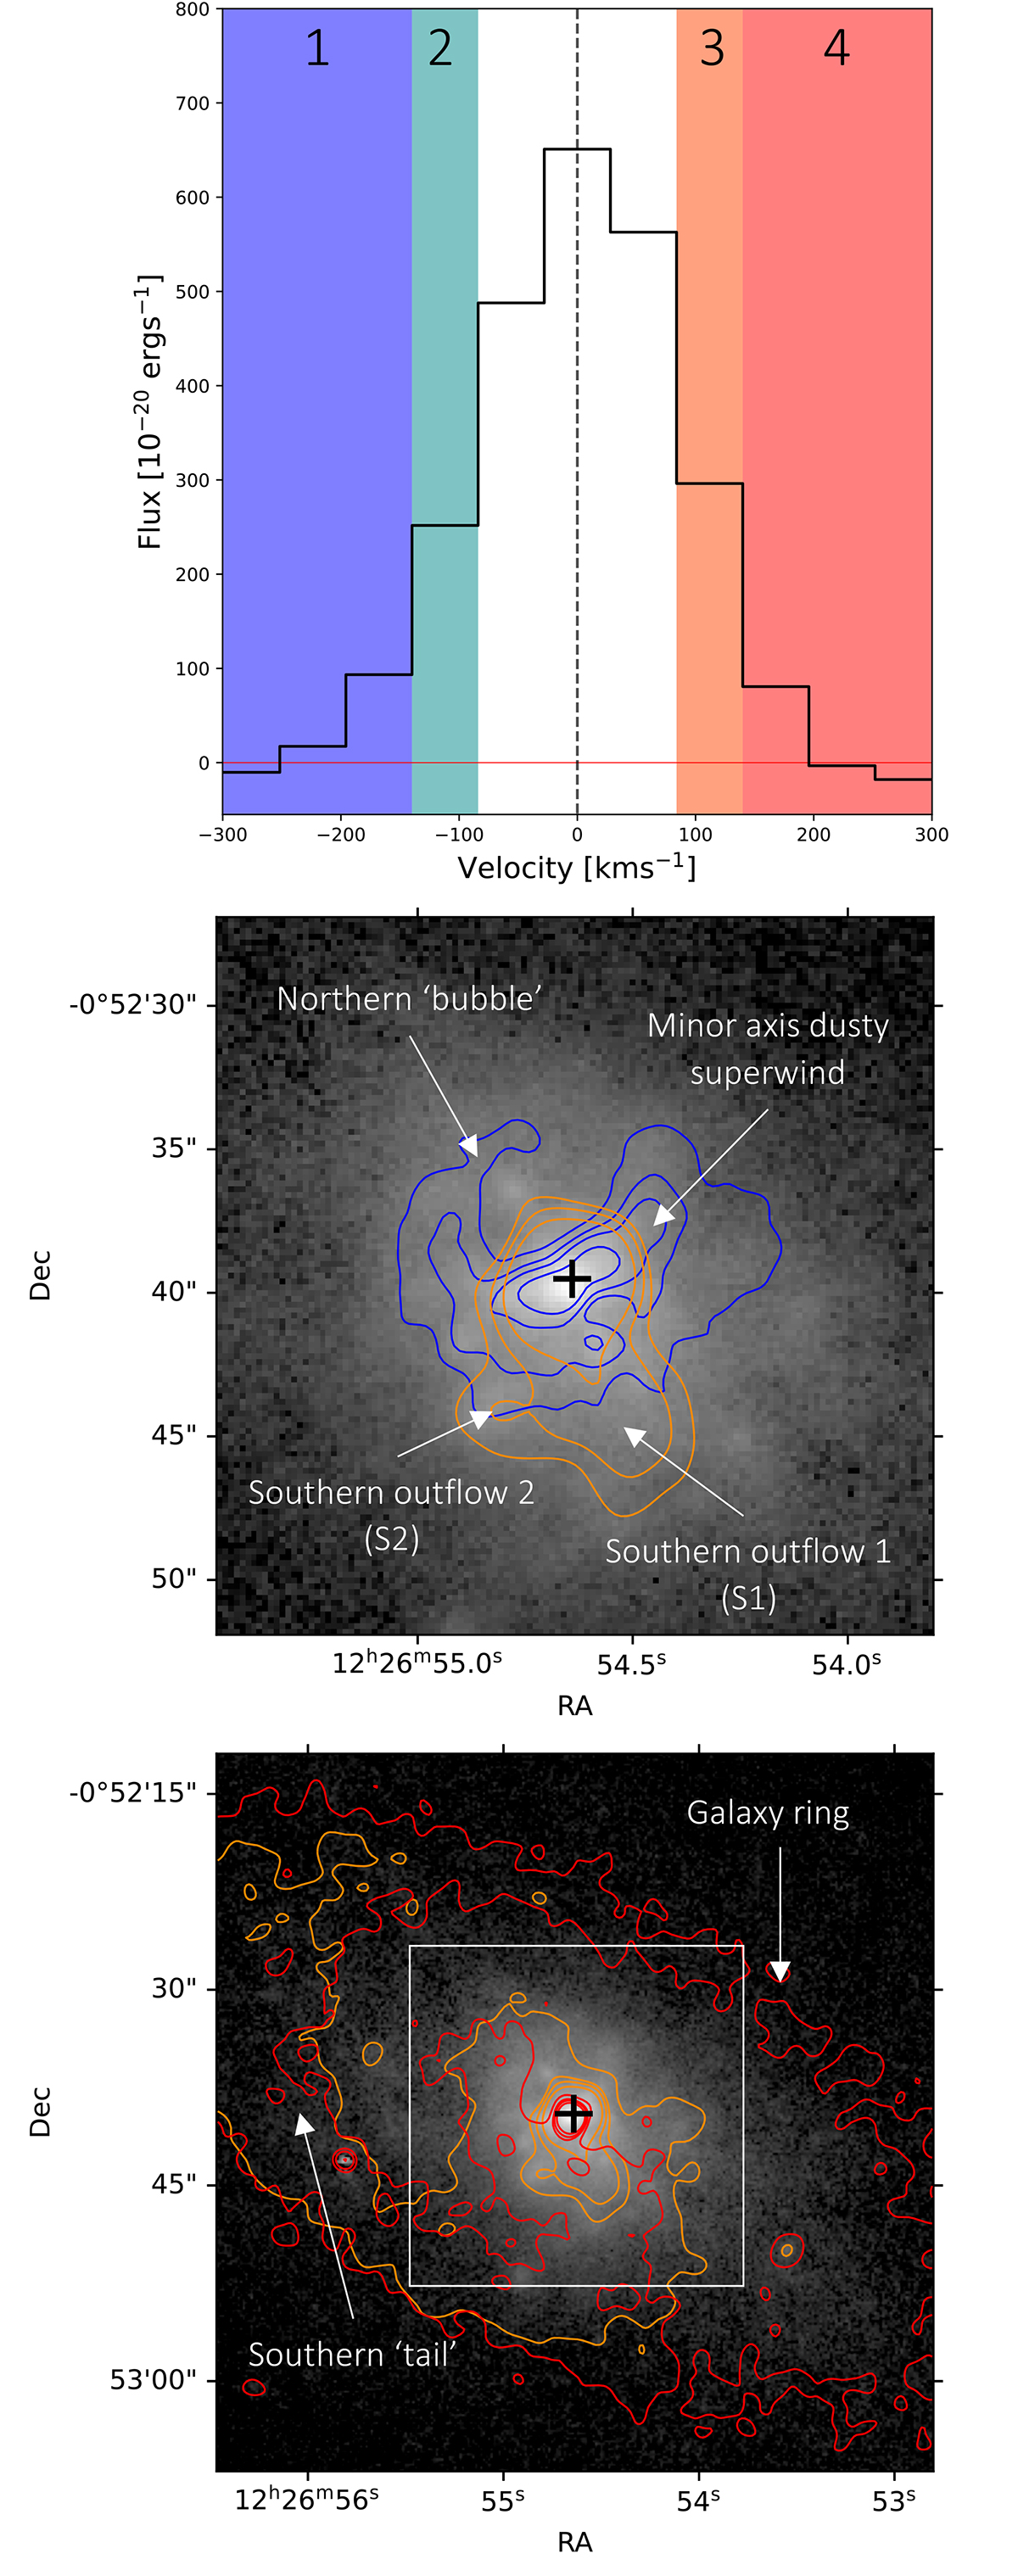
Download original image
Emission features in the Hα line wings. Upper: spectrum of Hα, extracted from a 2.5 arcsec (diameter) aperture centred on the CON position. Blue and red shaded regions are overlaid and labelled from 1–4. Regions 1 and 4 contain the highest velocity (140 < V > 305 km s−1) blue- and redshifted gas, respectively. Regions 2 and 3 map include the slower (85 < V > 140 km s−1) gas. Middle: emission of the fast blueshifted (region 1; blue contours) and slower redshifted (region 3; orange contours) Hα gas, overlaid onto the integrated Hα line map (log-scaled). Lower: emission of the fast (region 4; orange contours) and slower (region 3; red contours) redshifted Hα gas. White box shows the region shown in the middle panel.
Current usage metrics show cumulative count of Article Views (full-text article views including HTML views, PDF and ePub downloads, according to the available data) and Abstracts Views on Vision4Press platform.
Data correspond to usage on the plateform after 2015. The current usage metrics is available 48-96 hours after online publication and is updated daily on week days.
Initial download of the metrics may take a while.