Open Access
Fig. 8
Download original image
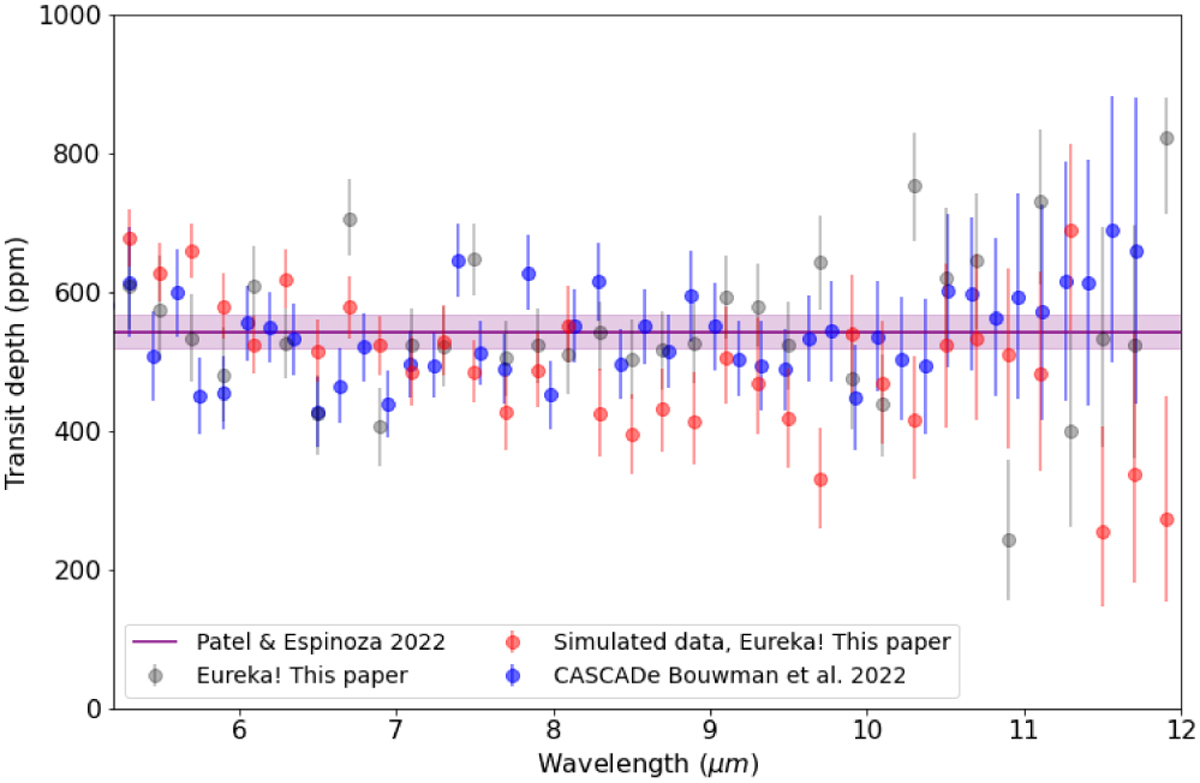
Transmission spectrum of L168-9b obtained from simulated (red dots) and real data (grey dots). The blue dots are the points from Bouwman et al. (2023), and the purple curve is the reference value from Patel & Espinoza (2022) along with the 95% confidence interval.
Current usage metrics show cumulative count of Article Views (full-text article views including HTML views, PDF and ePub downloads, according to the available data) and Abstracts Views on Vision4Press platform.
Data correspond to usage on the plateform after 2015. The current usage metrics is available 48-96 hours after online publication and is updated daily on week days.
Initial download of the metrics may take a while.