Fig. 7
Download original image
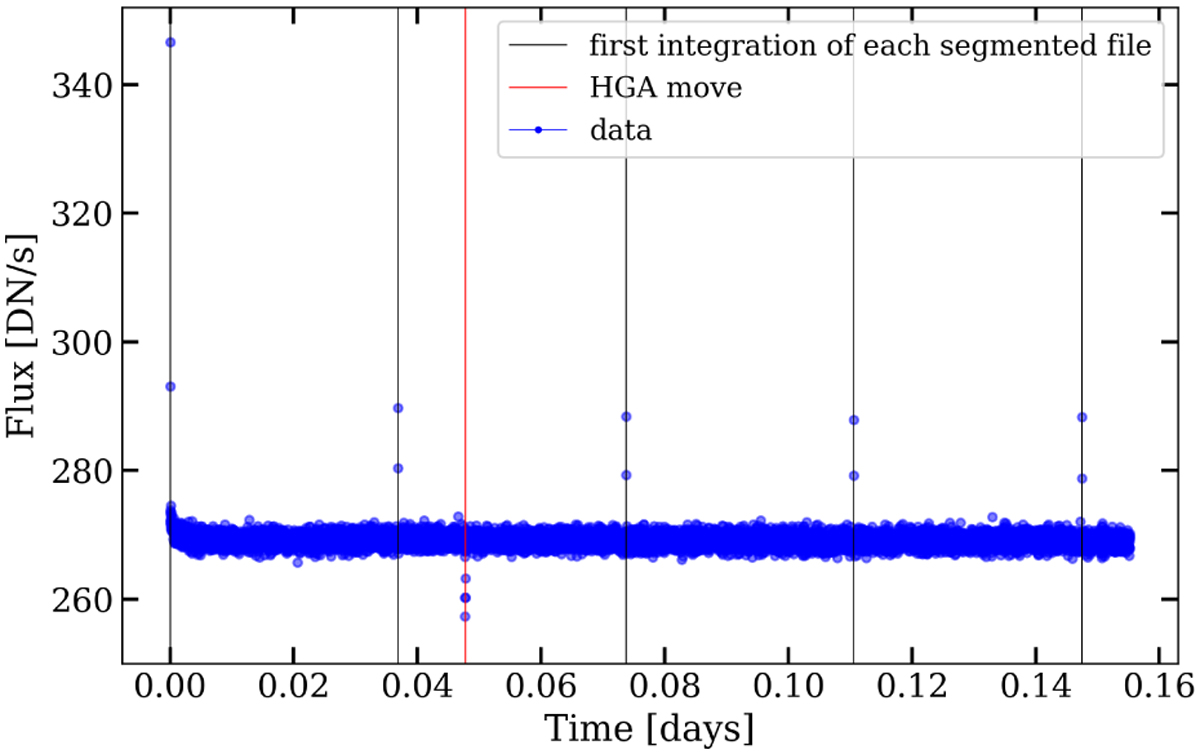
White light-curve over the whole MIRI LRS slitless subarray of the real observation of L168-9b. Outliers are detected in the whole time-series data points. The black lines mark the position of the first integration of each segmented file, and the red line shows the timing of the High Gain Antenna (HGA) move during the exposure.
Current usage metrics show cumulative count of Article Views (full-text article views including HTML views, PDF and ePub downloads, according to the available data) and Abstracts Views on Vision4Press platform.
Data correspond to usage on the plateform after 2015. The current usage metrics is available 48-96 hours after online publication and is updated daily on week days.
Initial download of the metrics may take a while.