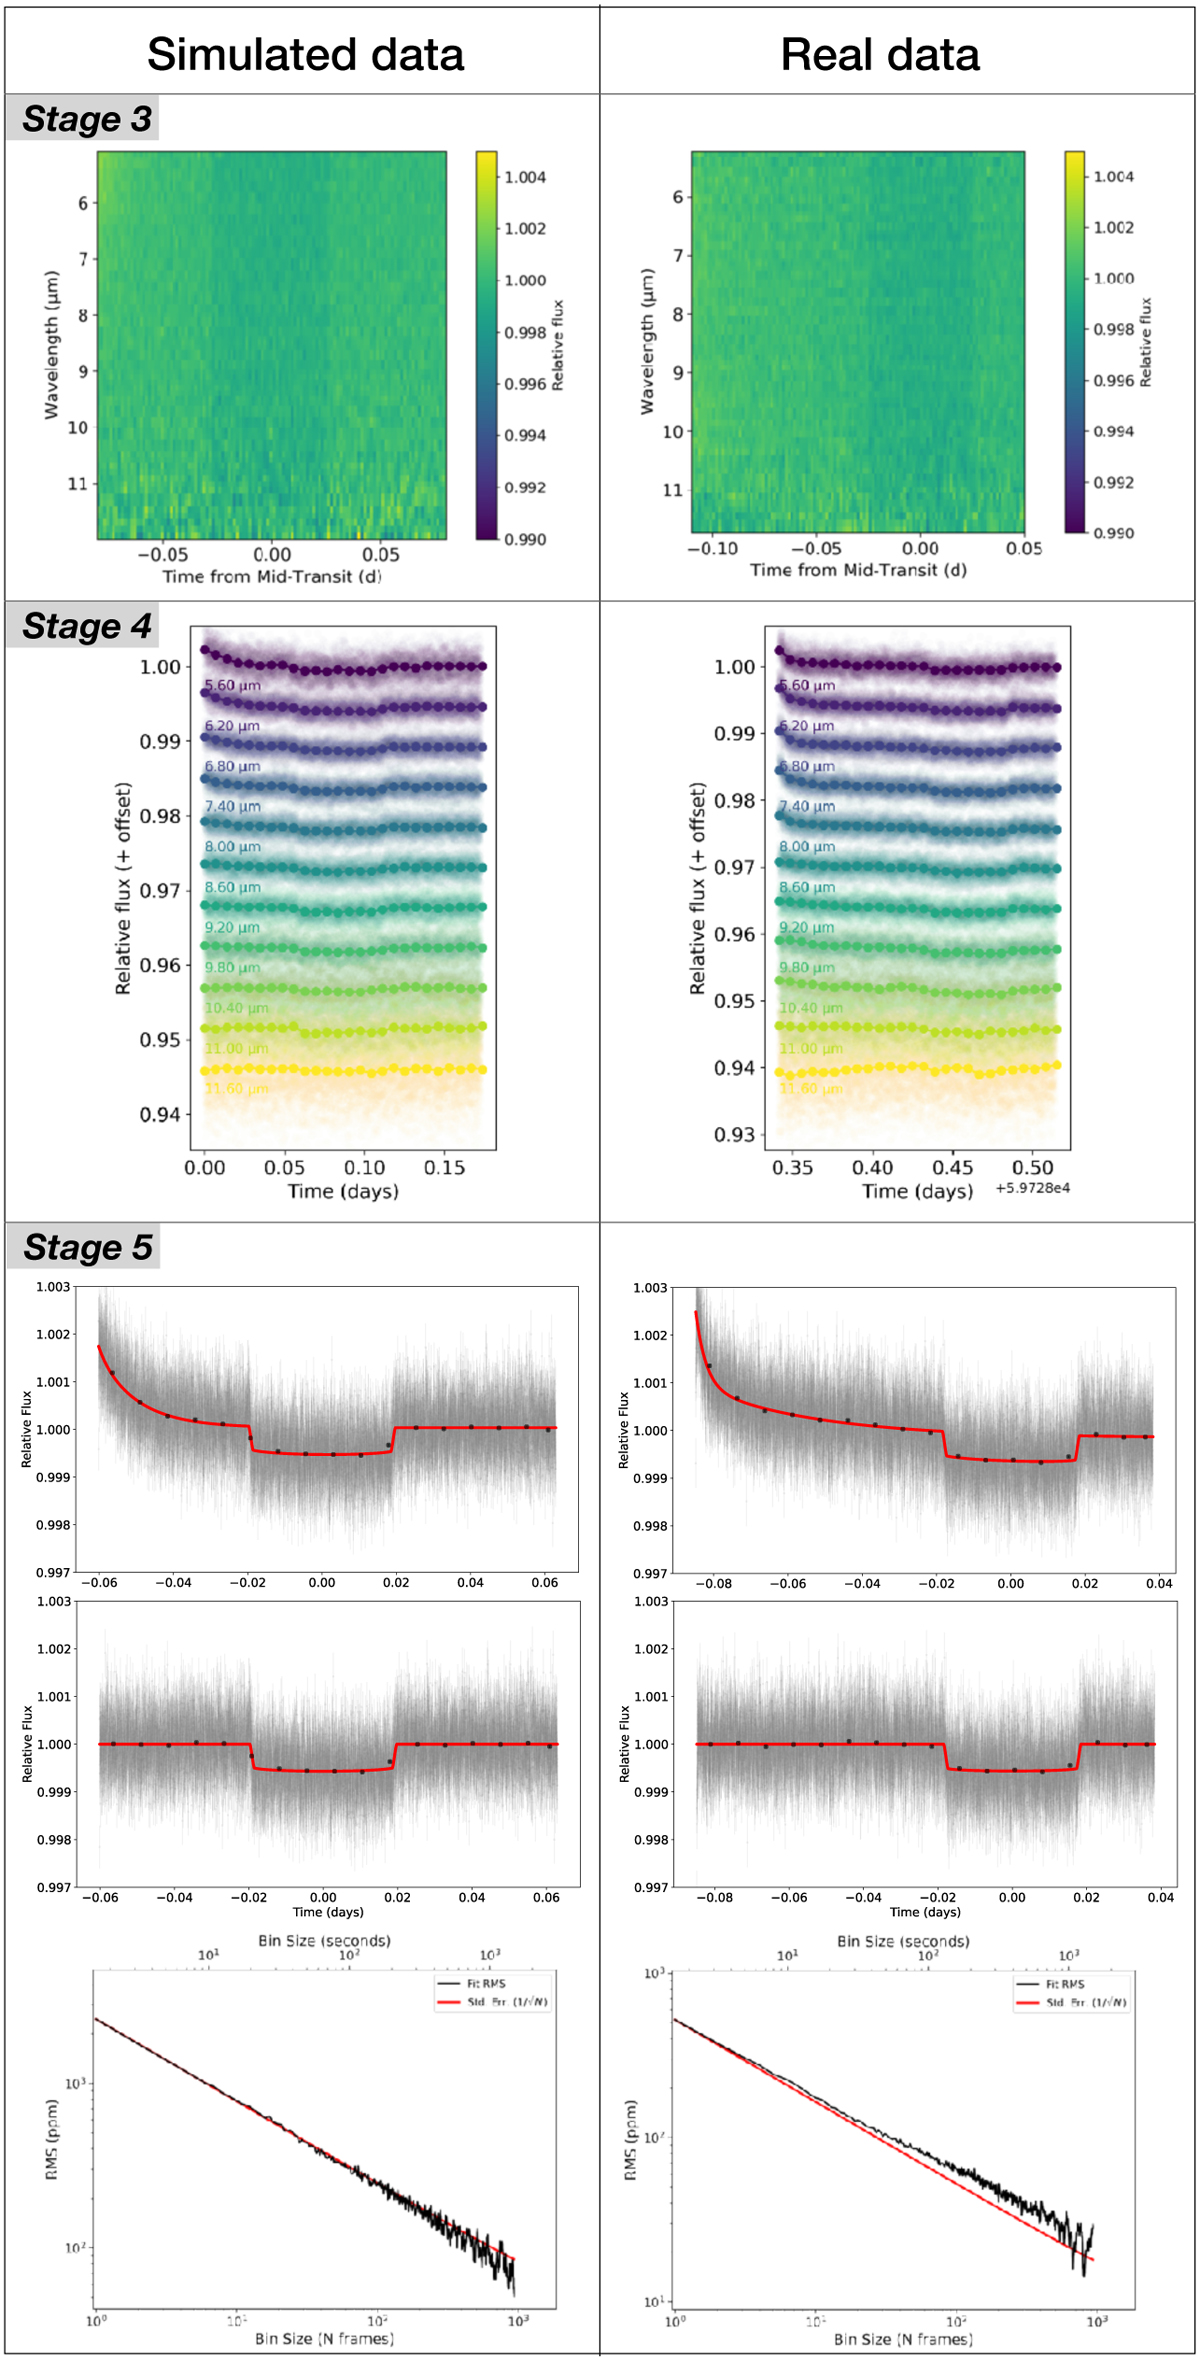
Fig. 6
Download original image
Comparison between real and simulated data at different stages of the reduction and analysis using Eureka! (Bell et al. 2022). Top panel: waterfall plots from stage 3. Centre panel: transit light curve as a function of wavelength, offset for clarity and produced with the chromatic package available at https://github.com/zkbt/chromatic visualisation tool. Bottom panel: raw and detrended white light-curve with the best-fit model resulting from the optimisation performed in stage 5 (red curves) and the corresponding Allan plot, showing the evolution of the root-mean-square (RMS) of the light curve as a function of the binning size. The photon-noise limit is almost reached in both cases, attesting to the Gaussianity of the residuals.
Current usage metrics show cumulative count of Article Views (full-text article views including HTML views, PDF and ePub downloads, according to the available data) and Abstracts Views on Vision4Press platform.
Data correspond to usage on the plateform after 2015. The current usage metrics is available 48-96 hours after online publication and is updated daily on week days.
Initial download of the metrics may take a while.