Fig. 5
Download original image
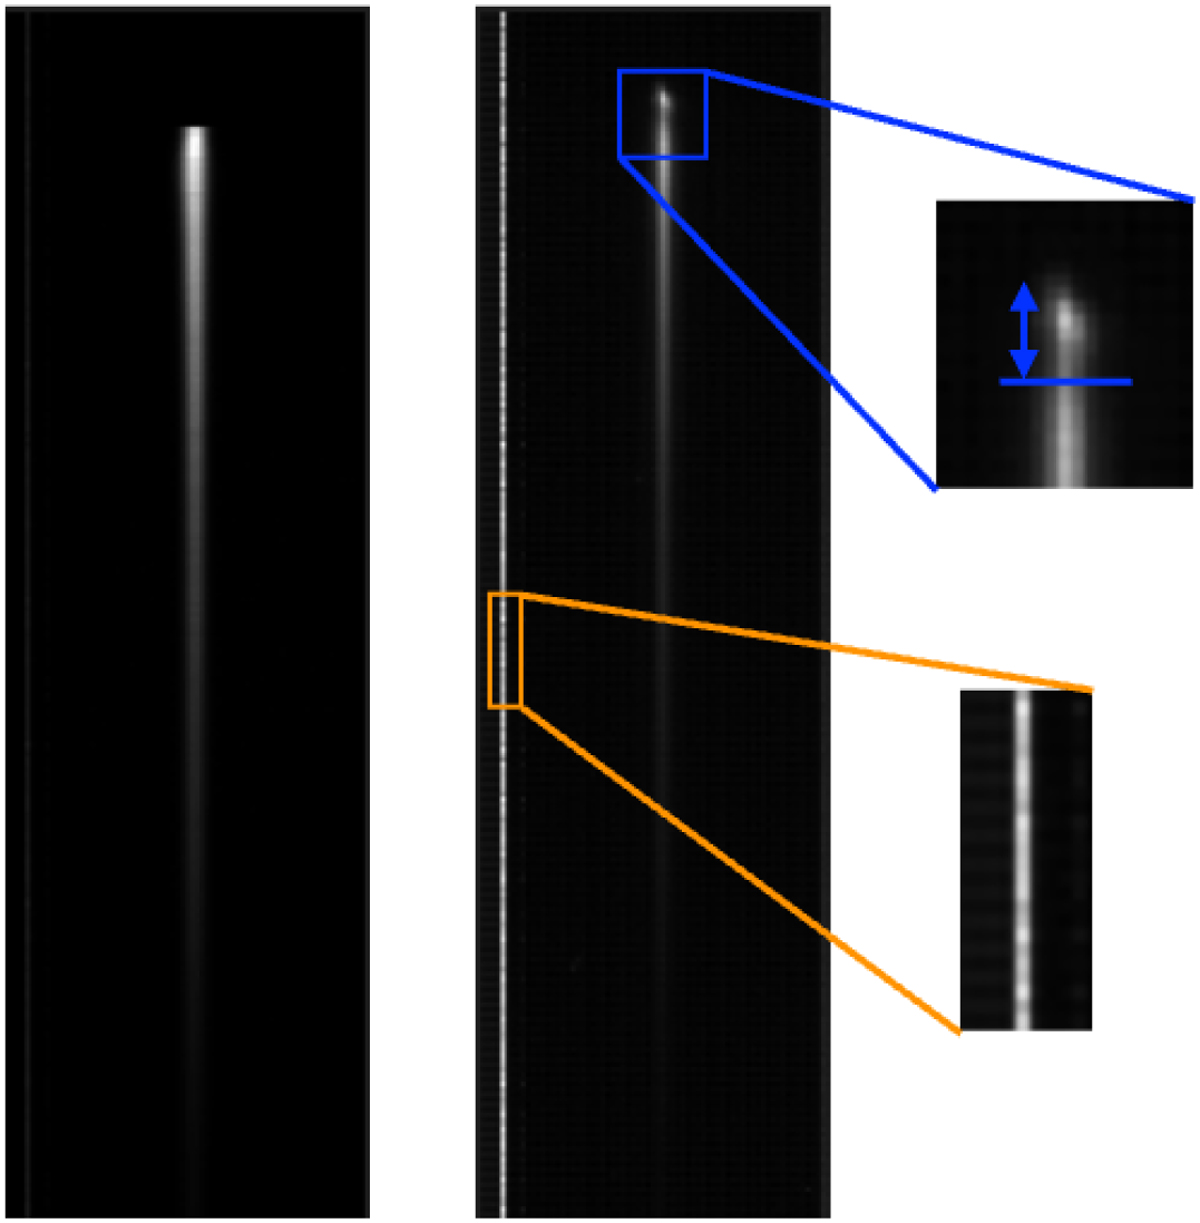
MIRI LRS slitless subarray 416 × 72 pixels, cut at pixel 155 at the bottom of the spectra. L168-9b raw simulations and comparison to uncalibrated real data. The left panel shows the simulated spectral image, and the right panel is taken from the uncalibrated data. Both images are the last (ninth) frame of the first integration. The vertical and horizontal directions are pixels. The vertical axis is the spectral dispersion direction and is related to the wavelengths. Thus, pixels with high fluxes are located in the top part of the vertical axis, at short wavelengths. Then, the flux level decreases as the wavelength increases along the vertical axis. The real data display a hot pixel column on the left that is fully saturated (a small part of it is encircled in orange). The upper part of the trace shows two distinct zones. The top part, indicated with the blue arrow, shows a spectral contamination (Bouwman et al. 2023; Bouchet et al. 2022).
Current usage metrics show cumulative count of Article Views (full-text article views including HTML views, PDF and ePub downloads, according to the available data) and Abstracts Views on Vision4Press platform.
Data correspond to usage on the plateform after 2015. The current usage metrics is available 48-96 hours after online publication and is updated daily on week days.
Initial download of the metrics may take a while.