Fig. 14
Download original image
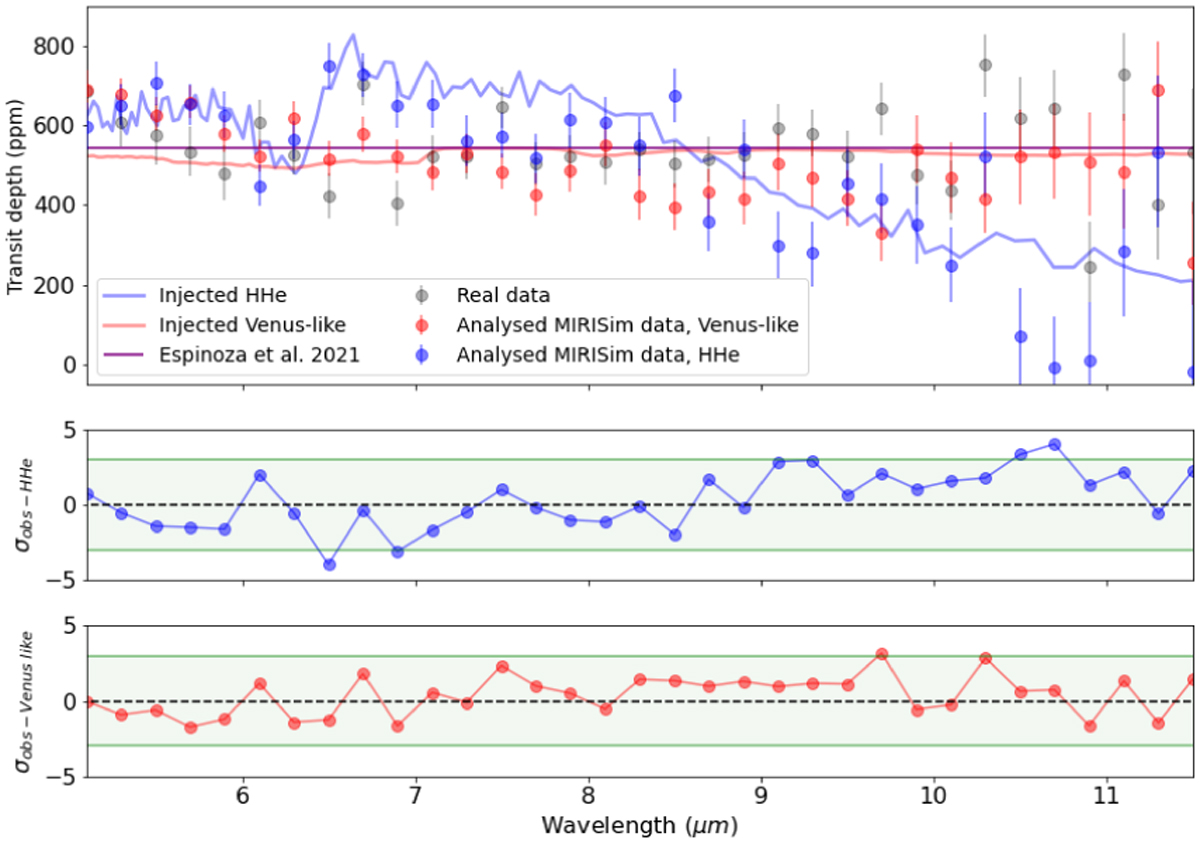
Transmission spectrum of L168-9b from the analysis of simulated data with MIRISim-TSO. Top: transmission spectra for two atmospheric scenarios, Venus-like (red dots) and H/He-dominated (blue dots), as well as from real commissioning data (grey dots). Middle: differences between the observed transit depth and the simulated transit depth for a hydrogen-helium-dominated atmosphere, where σ = ![]() , 3σ range indicated in green. Bottom: same as middle panel, but for the observed transit depth and the simulated transit depth for a Venus-like atmosphere.
, 3σ range indicated in green. Bottom: same as middle panel, but for the observed transit depth and the simulated transit depth for a Venus-like atmosphere.
Current usage metrics show cumulative count of Article Views (full-text article views including HTML views, PDF and ePub downloads, according to the available data) and Abstracts Views on Vision4Press platform.
Data correspond to usage on the plateform after 2015. The current usage metrics is available 48-96 hours after online publication and is updated daily on week days.
Initial download of the metrics may take a while.