Fig. 13
Download original image
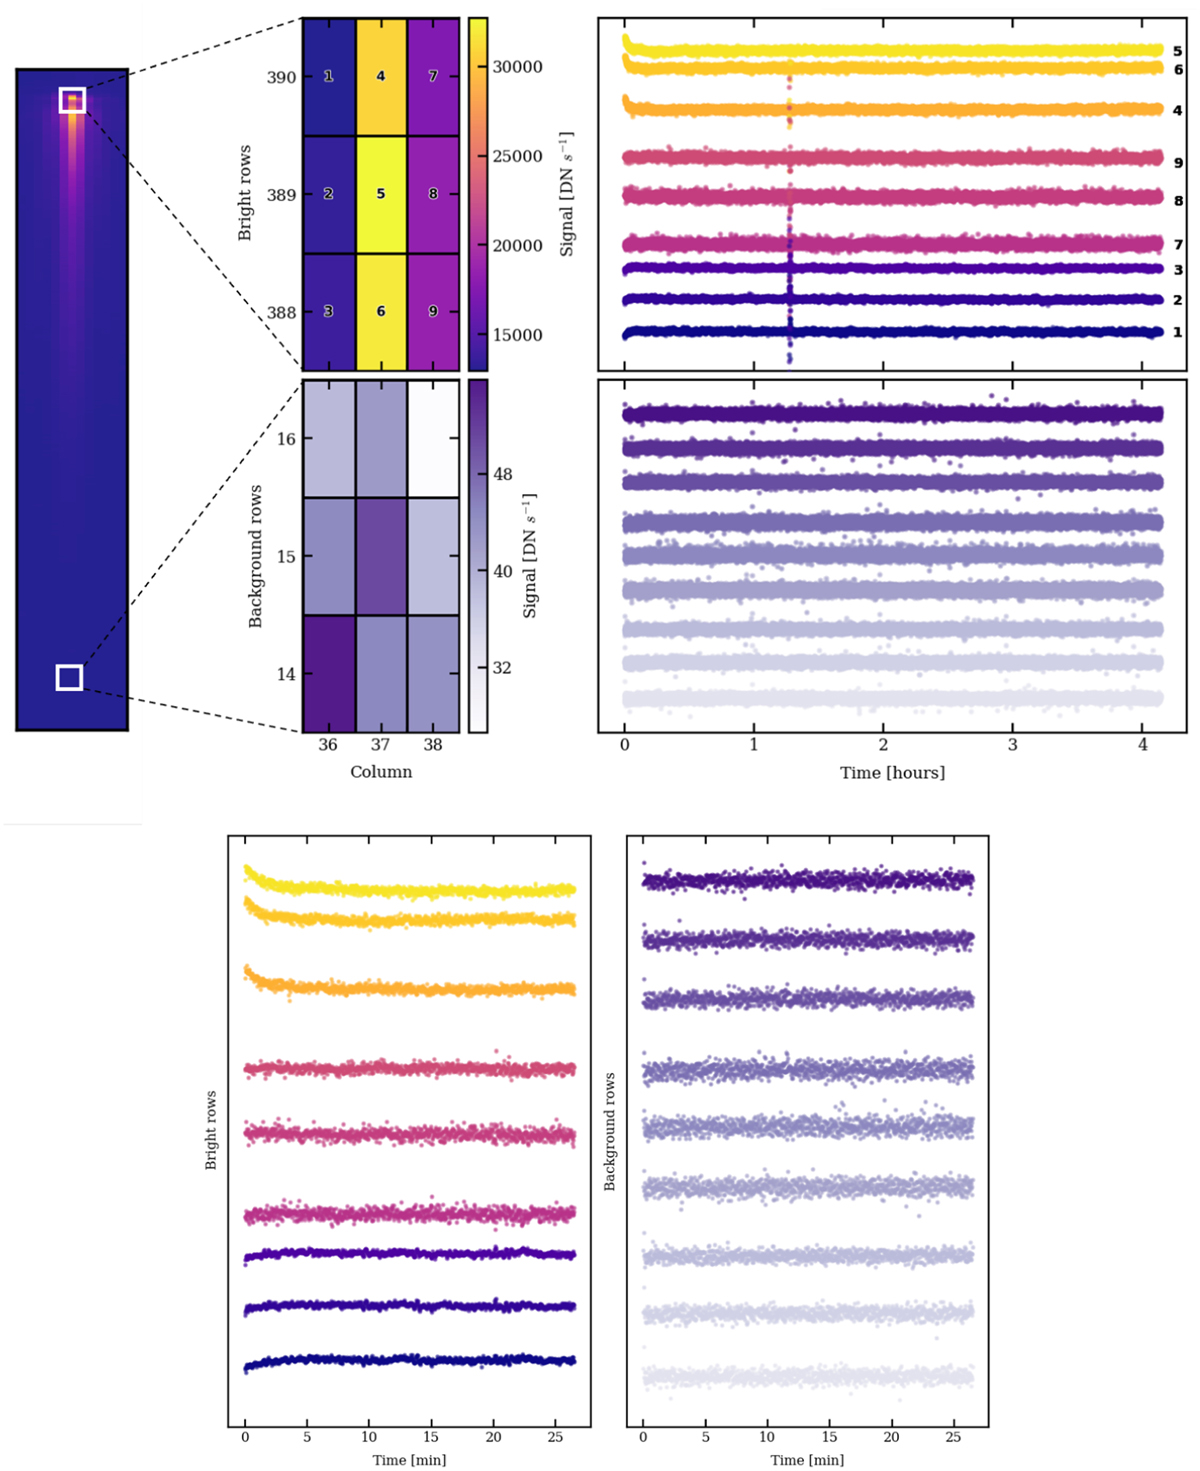
Depiction of persistence effects in the L168-9b data. Upper part: Full light curves. Bottom part: zoom into the beginning of the light curves up to half an hour. Top left panel: rectangular selection of nine pixels located in the spectral trace, at the highest flux levels. Top right panel: corresponding time series. Persistence effects are visible at the beginning of each time series for less than approximately 30 min. Bottom left panel: selection of pixels located in the background. All pixels display a really low but yet similar amount of flux between 30 and 50 DN s−1. Bottom right panel: corresponding time series in which no persistence effect is visible for these pixels.
Current usage metrics show cumulative count of Article Views (full-text article views including HTML views, PDF and ePub downloads, according to the available data) and Abstracts Views on Vision4Press platform.
Data correspond to usage on the plateform after 2015. The current usage metrics is available 48-96 hours after online publication and is updated daily on week days.
Initial download of the metrics may take a while.