Fig. 6
Download original image
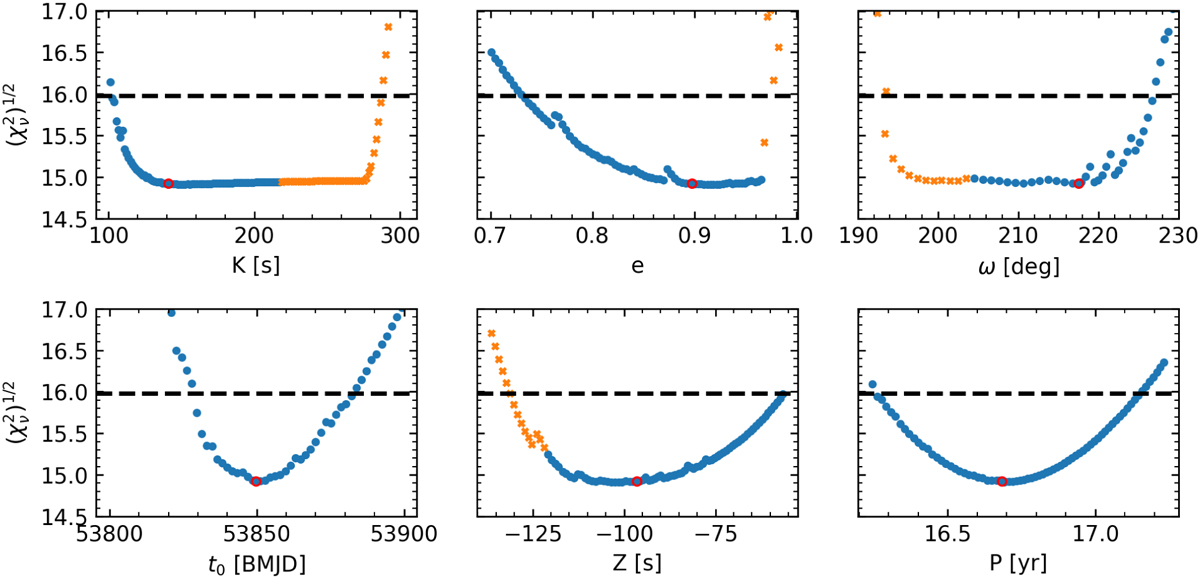
Goodness-of-fit ![]() as a function of a fixed parameter 𝒜i, while letting the remaining parameters vary freely. The red circle marks the best-fit value (𝒜BF as determined from the genetic-simplex method). The dashed line marks the value of
as a function of a fixed parameter 𝒜i, while letting the remaining parameters vary freely. The red circle marks the best-fit value (𝒜BF as determined from the genetic-simplex method). The dashed line marks the value of ![]() defined in Eq. (8). The intersection of
defined in Eq. (8). The intersection of ![]() with the blue points defines the 1σ confidence interval for the parameter 𝒜i (see the results in Table 2). Orange circles correspond to chaotic orbits, with 〈Y〉 ≳ 2.1 (see the text).
with the blue points defines the 1σ confidence interval for the parameter 𝒜i (see the results in Table 2). Orange circles correspond to chaotic orbits, with 〈Y〉 ≳ 2.1 (see the text).
Current usage metrics show cumulative count of Article Views (full-text article views including HTML views, PDF and ePub downloads, according to the available data) and Abstracts Views on Vision4Press platform.
Data correspond to usage on the plateform after 2015. The current usage metrics is available 48-96 hours after online publication and is updated daily on week days.
Initial download of the metrics may take a while.