Fig. 4
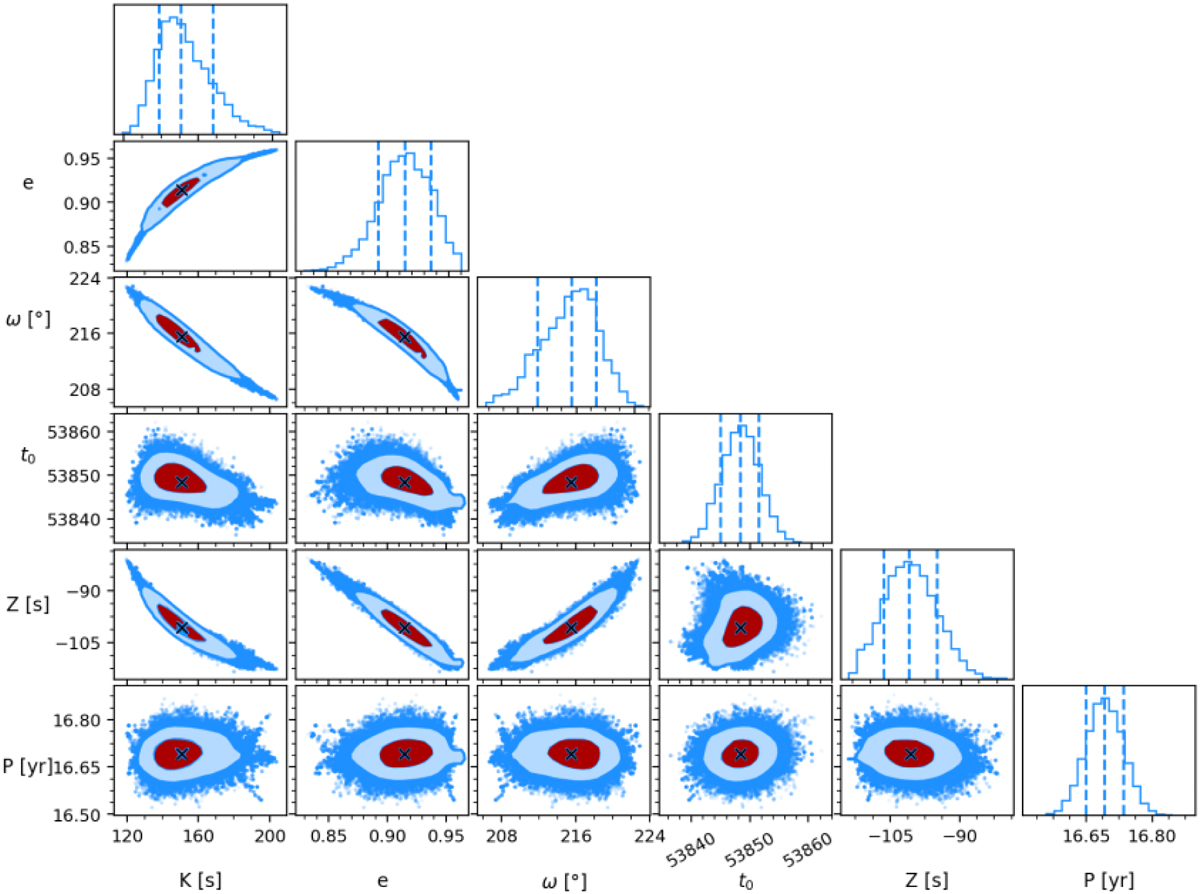
Download original image
Results of MCMC chains selecting pairs of parameters. We estimate the uncertainties using the posterior distribution of MCMC chains. Mean values, i.e., best-fit solutions, are plotted with black crosses. Level curves indicate 1σ (dark red) and 2σ (light blue) levels of posterior distributions. We note that for 2D histograms, these values correspond to roughly 39 and 86% confidence levels of the mean. In the top panels, we show the posterior distributions with their quantile levels at 0.14, 0.5, and 0.84. Here, t0 is given as a BMJD.
Current usage metrics show cumulative count of Article Views (full-text article views including HTML views, PDF and ePub downloads, according to the available data) and Abstracts Views on Vision4Press platform.
Data correspond to usage on the plateform after 2015. The current usage metrics is available 48-96 hours after online publication and is updated daily on week days.
Initial download of the metrics may take a while.