Fig. 3
Download original image
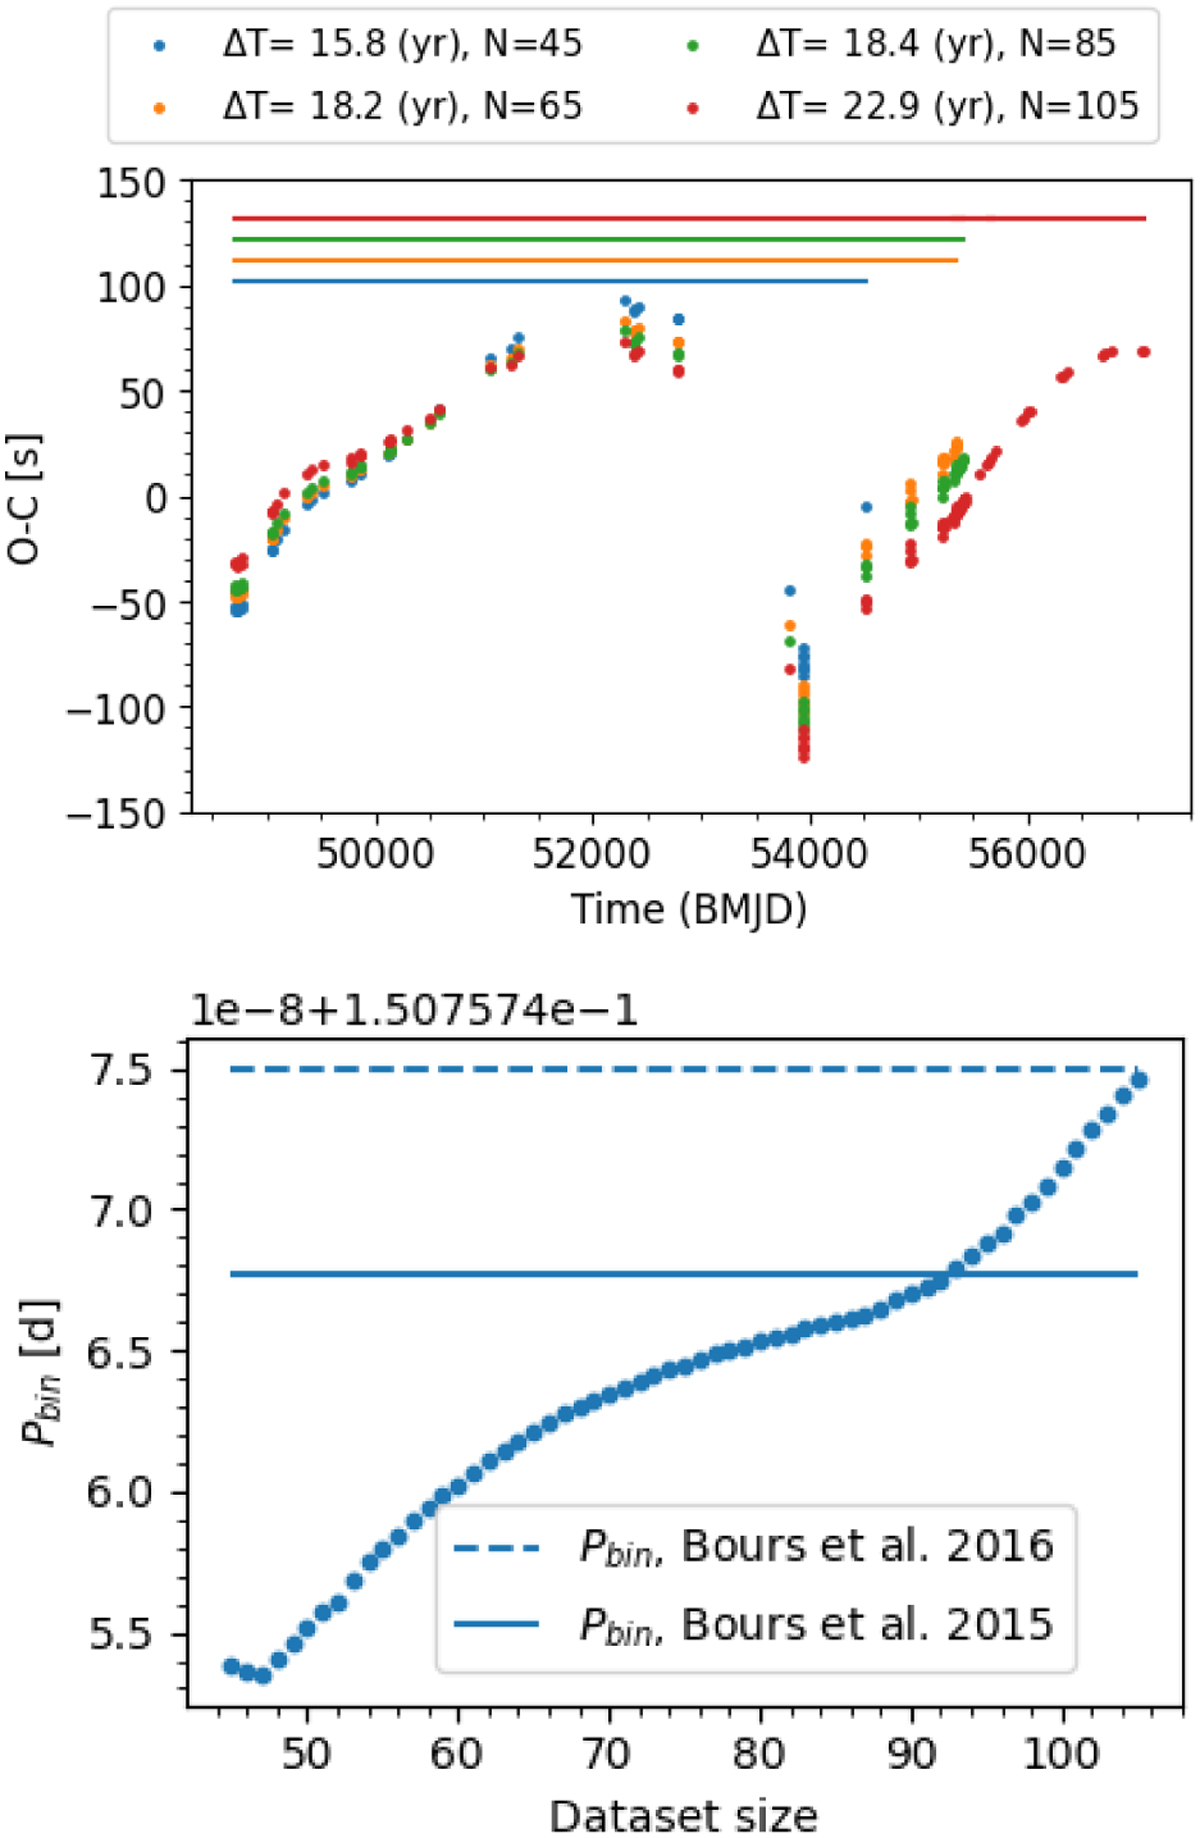
Dependence of the shape of the O – C and the period of the binary on the dataset considered. Top panel: O – C signal produced using four different datasets that mimic available observational data. Data point colors correspond to different datasets and horizontal lines at the top help to identify the corresponding observational baseline (ΔT). Bottom panel: determination of the binary period from the linear ephemeris as a function of the dataset. The horizontal solid and dashed lines represent the values of Pbin given by Bours (2015) and O’Donoghue et al. (2003), respectively. Pbin changes depending on the dataset selected.
Current usage metrics show cumulative count of Article Views (full-text article views including HTML views, PDF and ePub downloads, according to the available data) and Abstracts Views on Vision4Press platform.
Data correspond to usage on the plateform after 2015. The current usage metrics is available 48-96 hours after online publication and is updated daily on week days.
Initial download of the metrics may take a while.