Fig. 2
Download original image
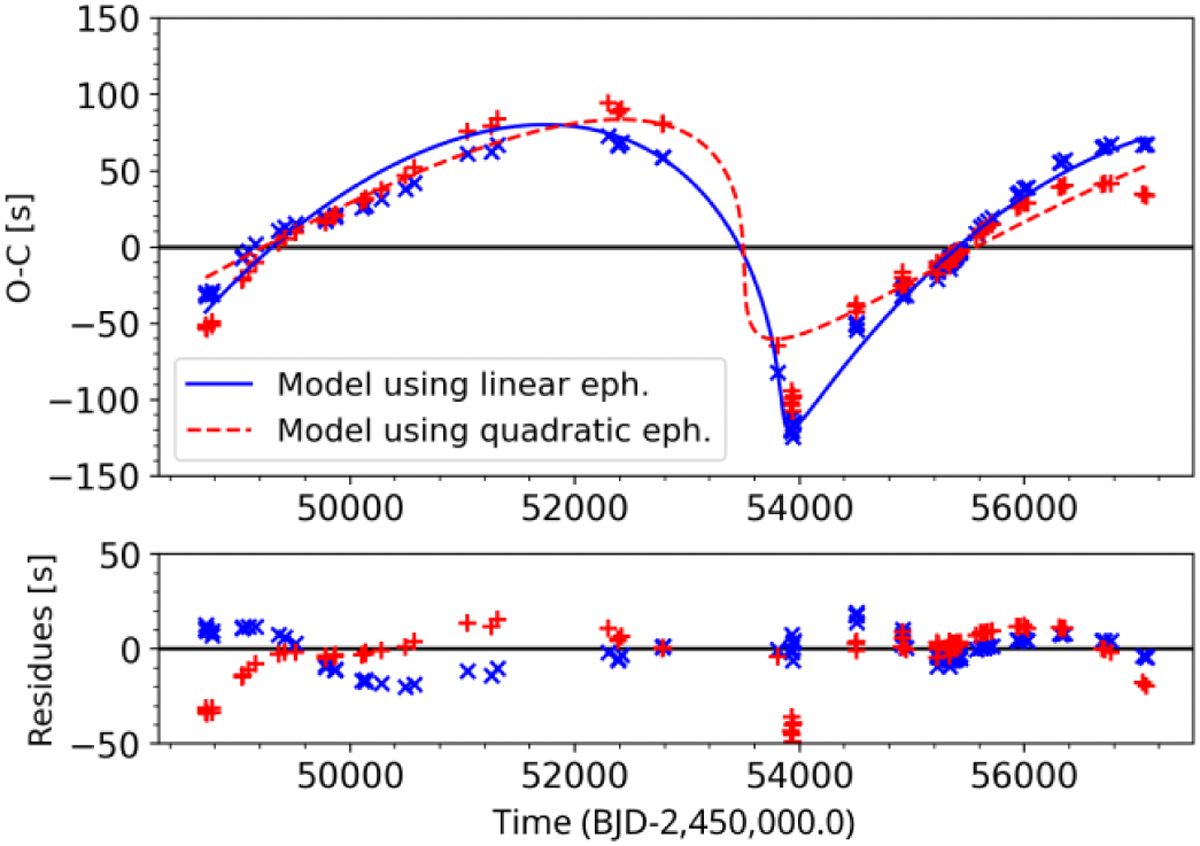
Best orbital fits and residuals. Upper panel: O – C diagram of QS Vir. The crosses and plus symbols represent the O – C values built with the linear and quadratic ephemeris, respectively (O – C = Tcalc-Eq. (2)). The solid line and the dashed line represent the models fitted using the two models as described in the text. Lower panel: residuals using the same symbol and color coding as the top panel.
Current usage metrics show cumulative count of Article Views (full-text article views including HTML views, PDF and ePub downloads, according to the available data) and Abstracts Views on Vision4Press platform.
Data correspond to usage on the plateform after 2015. The current usage metrics is available 48-96 hours after online publication and is updated daily on week days.
Initial download of the metrics may take a while.