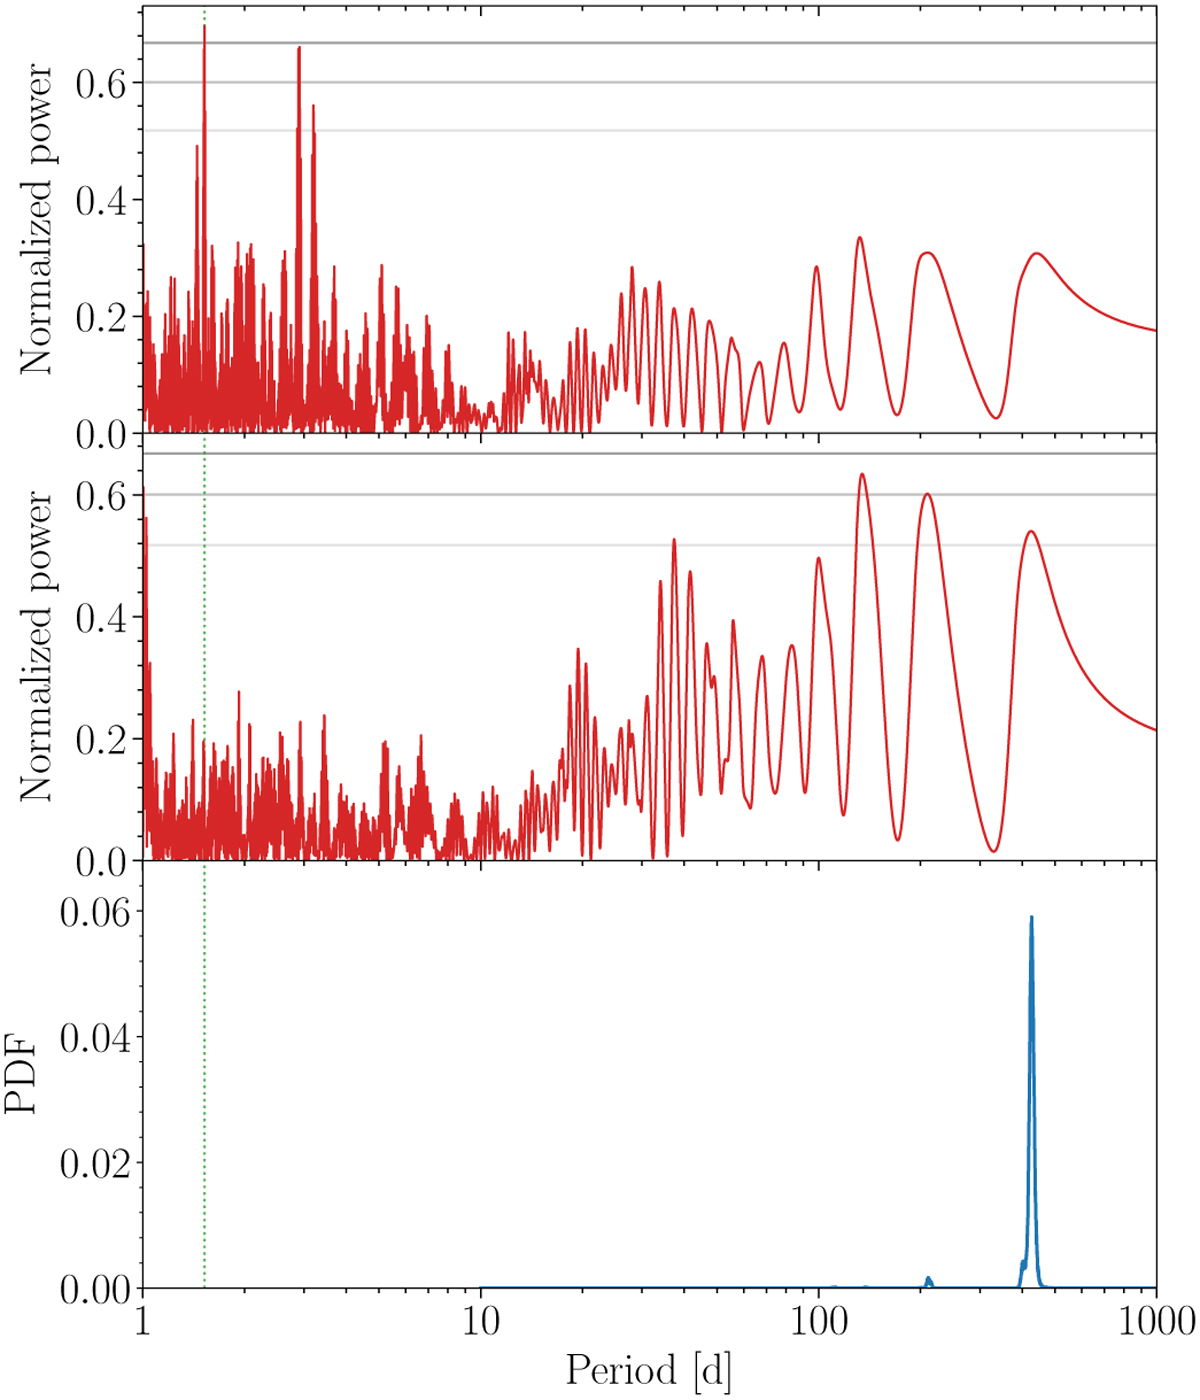
Fig. A.3
Download original image
Periodogram of the SPIRou data. Top panel: generalised Lomb–Scargle (GLS) periodogram (Zechmeister & Kürster 2009) of the nightly averaged SPIRou velocities for TOI-4860 (red line). The horizontal lines represents 10, 1, and 0.1% false-alarm levels, from bottom to top. The vertical dotted green line marks the period of the transiting planet. Middle panel: idem after subtracting the Keplerian orbit of planet b. Given that the planet c candidate has a significant eccentricity, the power of the GLS periodogram is partially transferred to the harmonics of the orbital period, which leads to a reduced peak amplitude. Bottom panel: marginal posterior distribution of the period of a second planet search with SPIRou and ESPRESSO (Sect. 4.3).
Current usage metrics show cumulative count of Article Views (full-text article views including HTML views, PDF and ePub downloads, according to the available data) and Abstracts Views on Vision4Press platform.
Data correspond to usage on the plateform after 2015. The current usage metrics is available 48-96 hours after online publication and is updated daily on week days.
Initial download of the metrics may take a while.