Fig. B.2
Download original image
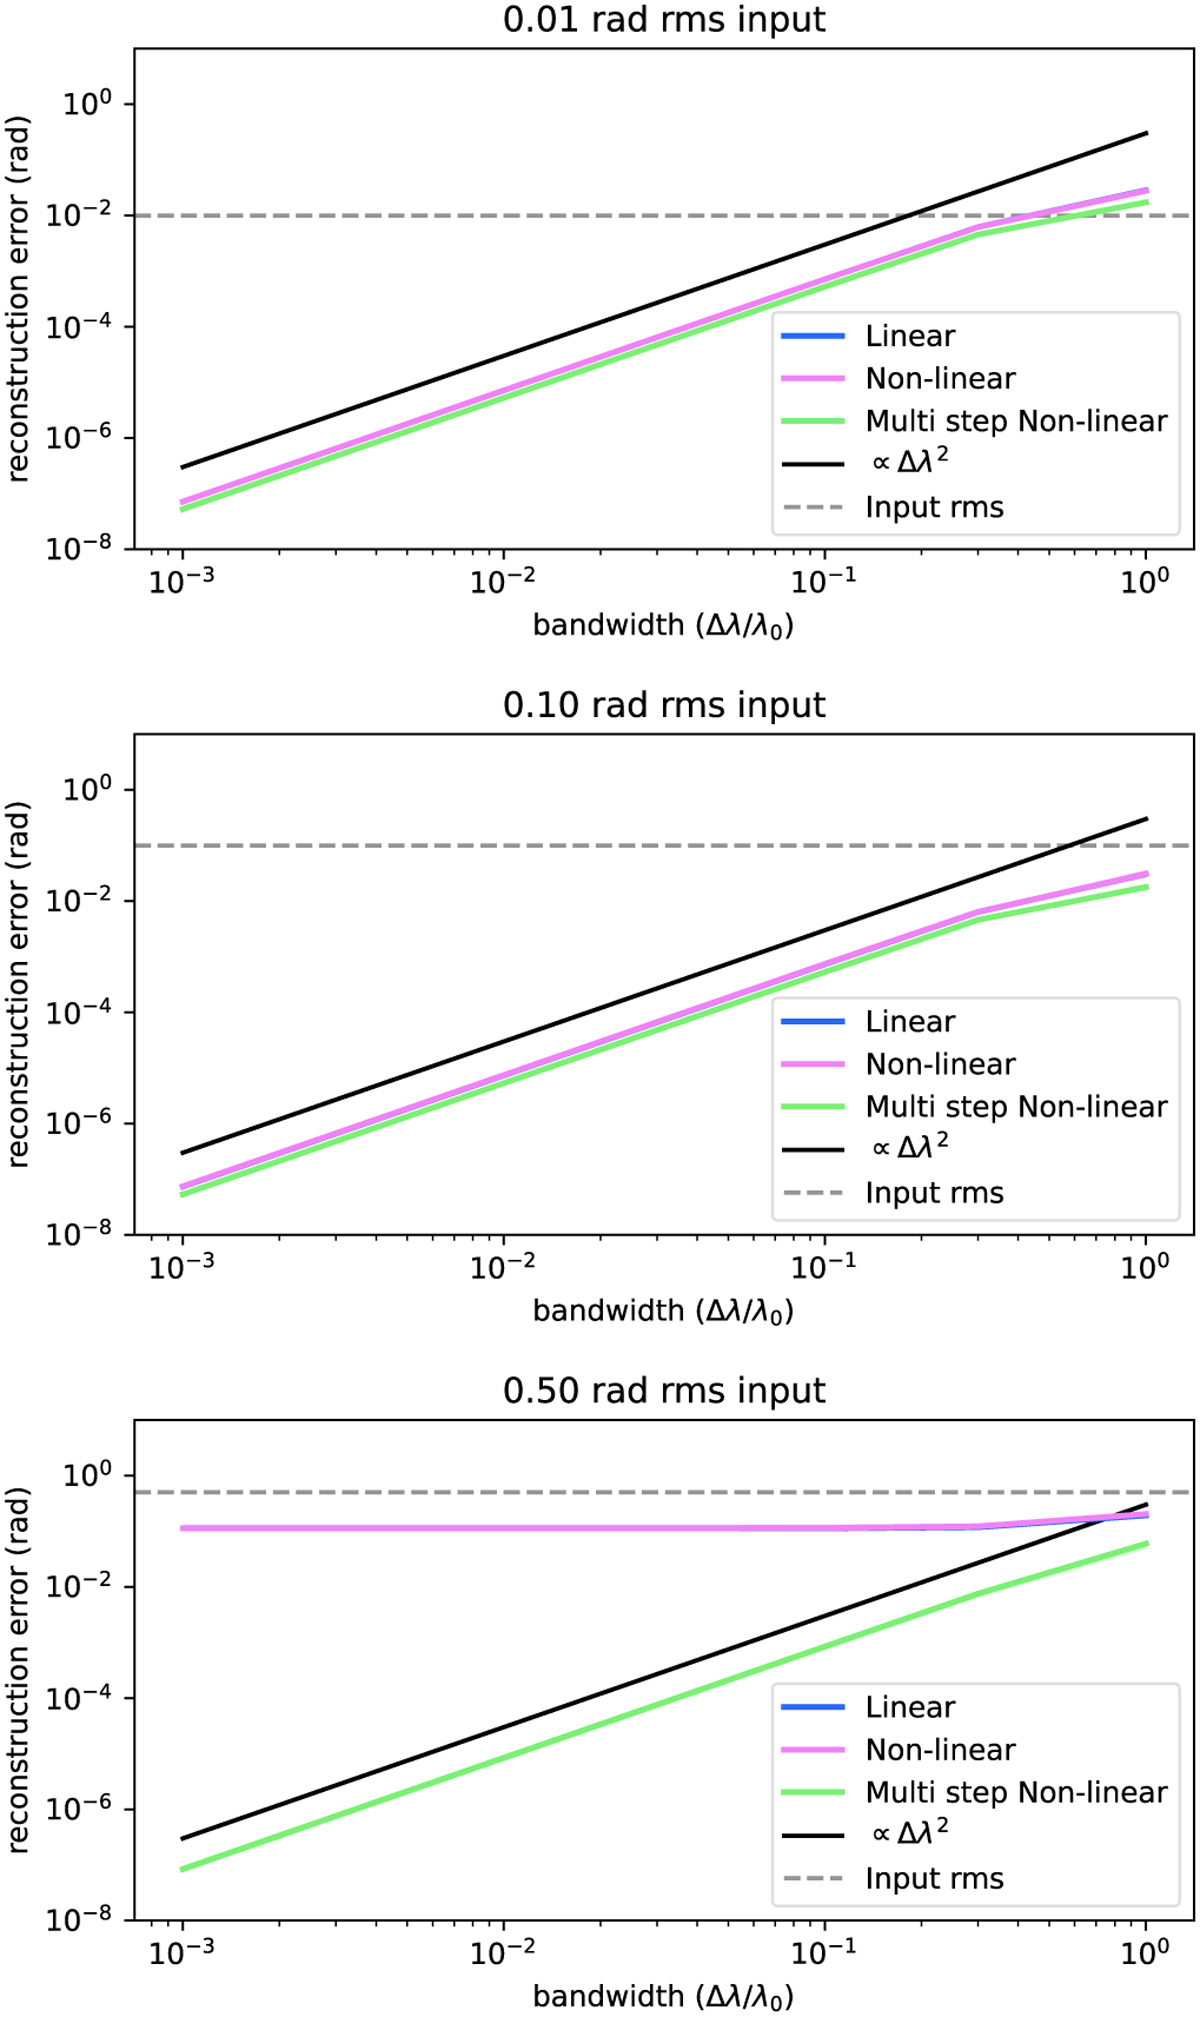
Reconstruction error as a function of bandwidth for the different reconstructors. The top, middle, and bottom panels show the reconstruction error for different input rms values. The top and middle panels show that the reconstruction error grows as the bandwidth squared. The bottom panel shows the results for an rms value that is outside the dynamic range of the single-step algorithms.
Current usage metrics show cumulative count of Article Views (full-text article views including HTML views, PDF and ePub downloads, according to the available data) and Abstracts Views on Vision4Press platform.
Data correspond to usage on the plateform after 2015. The current usage metrics is available 48-96 hours after online publication and is updated daily on week days.
Initial download of the metrics may take a while.