Open Access
Fig. 5
Download original image
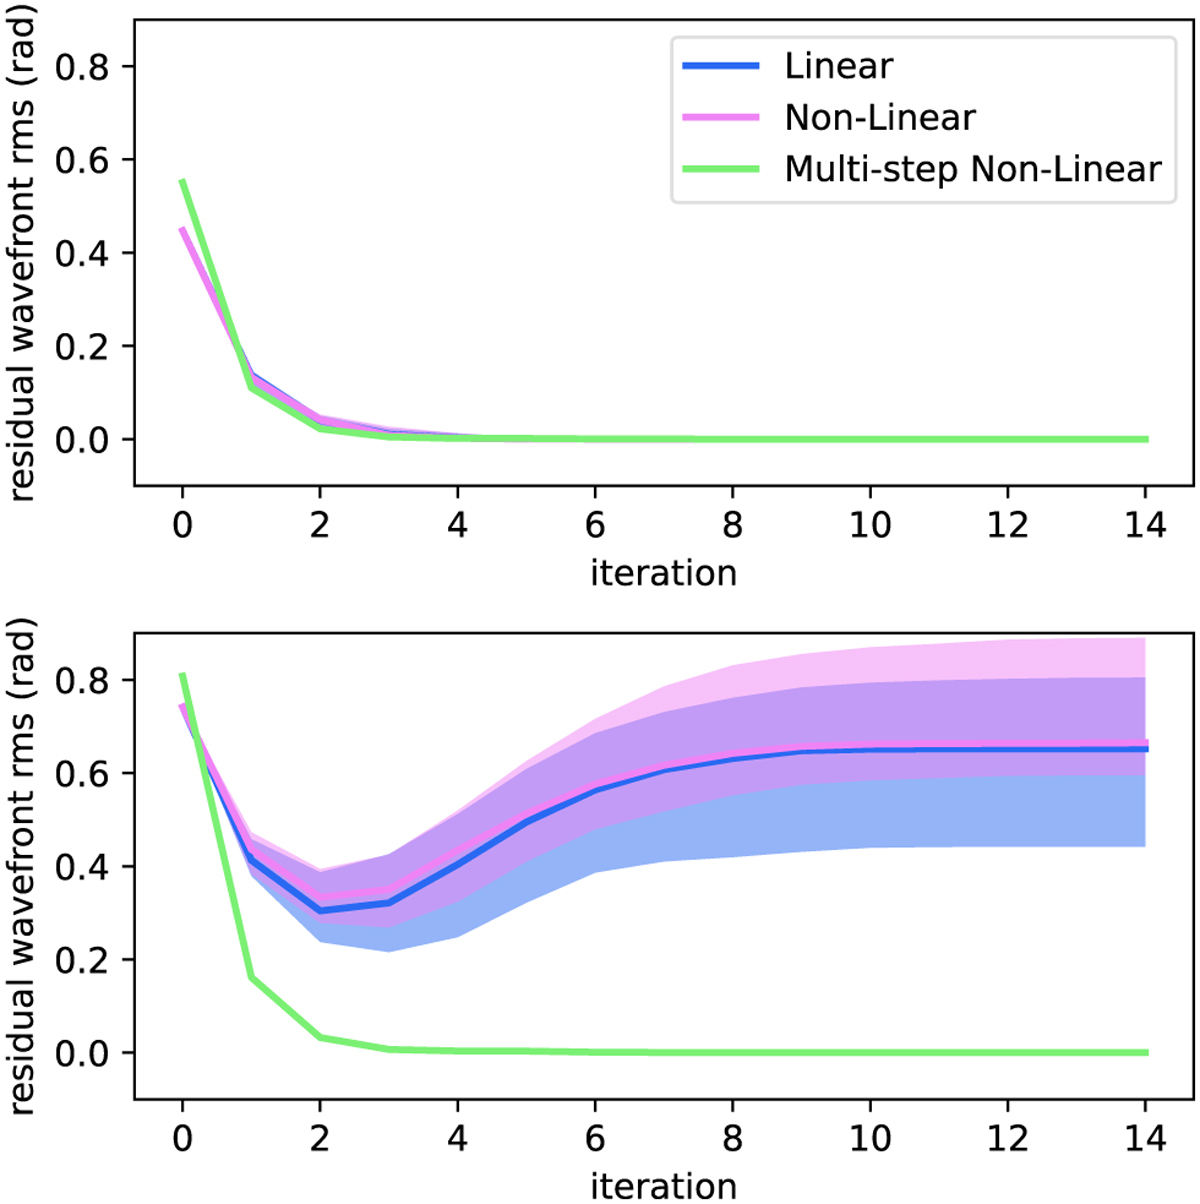
Closed-loop performance as a function of the number of iterations. The solid curve is the median performance across 15 different realizations and the shaded area depicts the 1σ boundary. The different colors correspond to the different reconstruction algorithms.
Current usage metrics show cumulative count of Article Views (full-text article views including HTML views, PDF and ePub downloads, according to the available data) and Abstracts Views on Vision4Press platform.
Data correspond to usage on the plateform after 2015. The current usage metrics is available 48-96 hours after online publication and is updated daily on week days.
Initial download of the metrics may take a while.