Fig. 1
Download original image
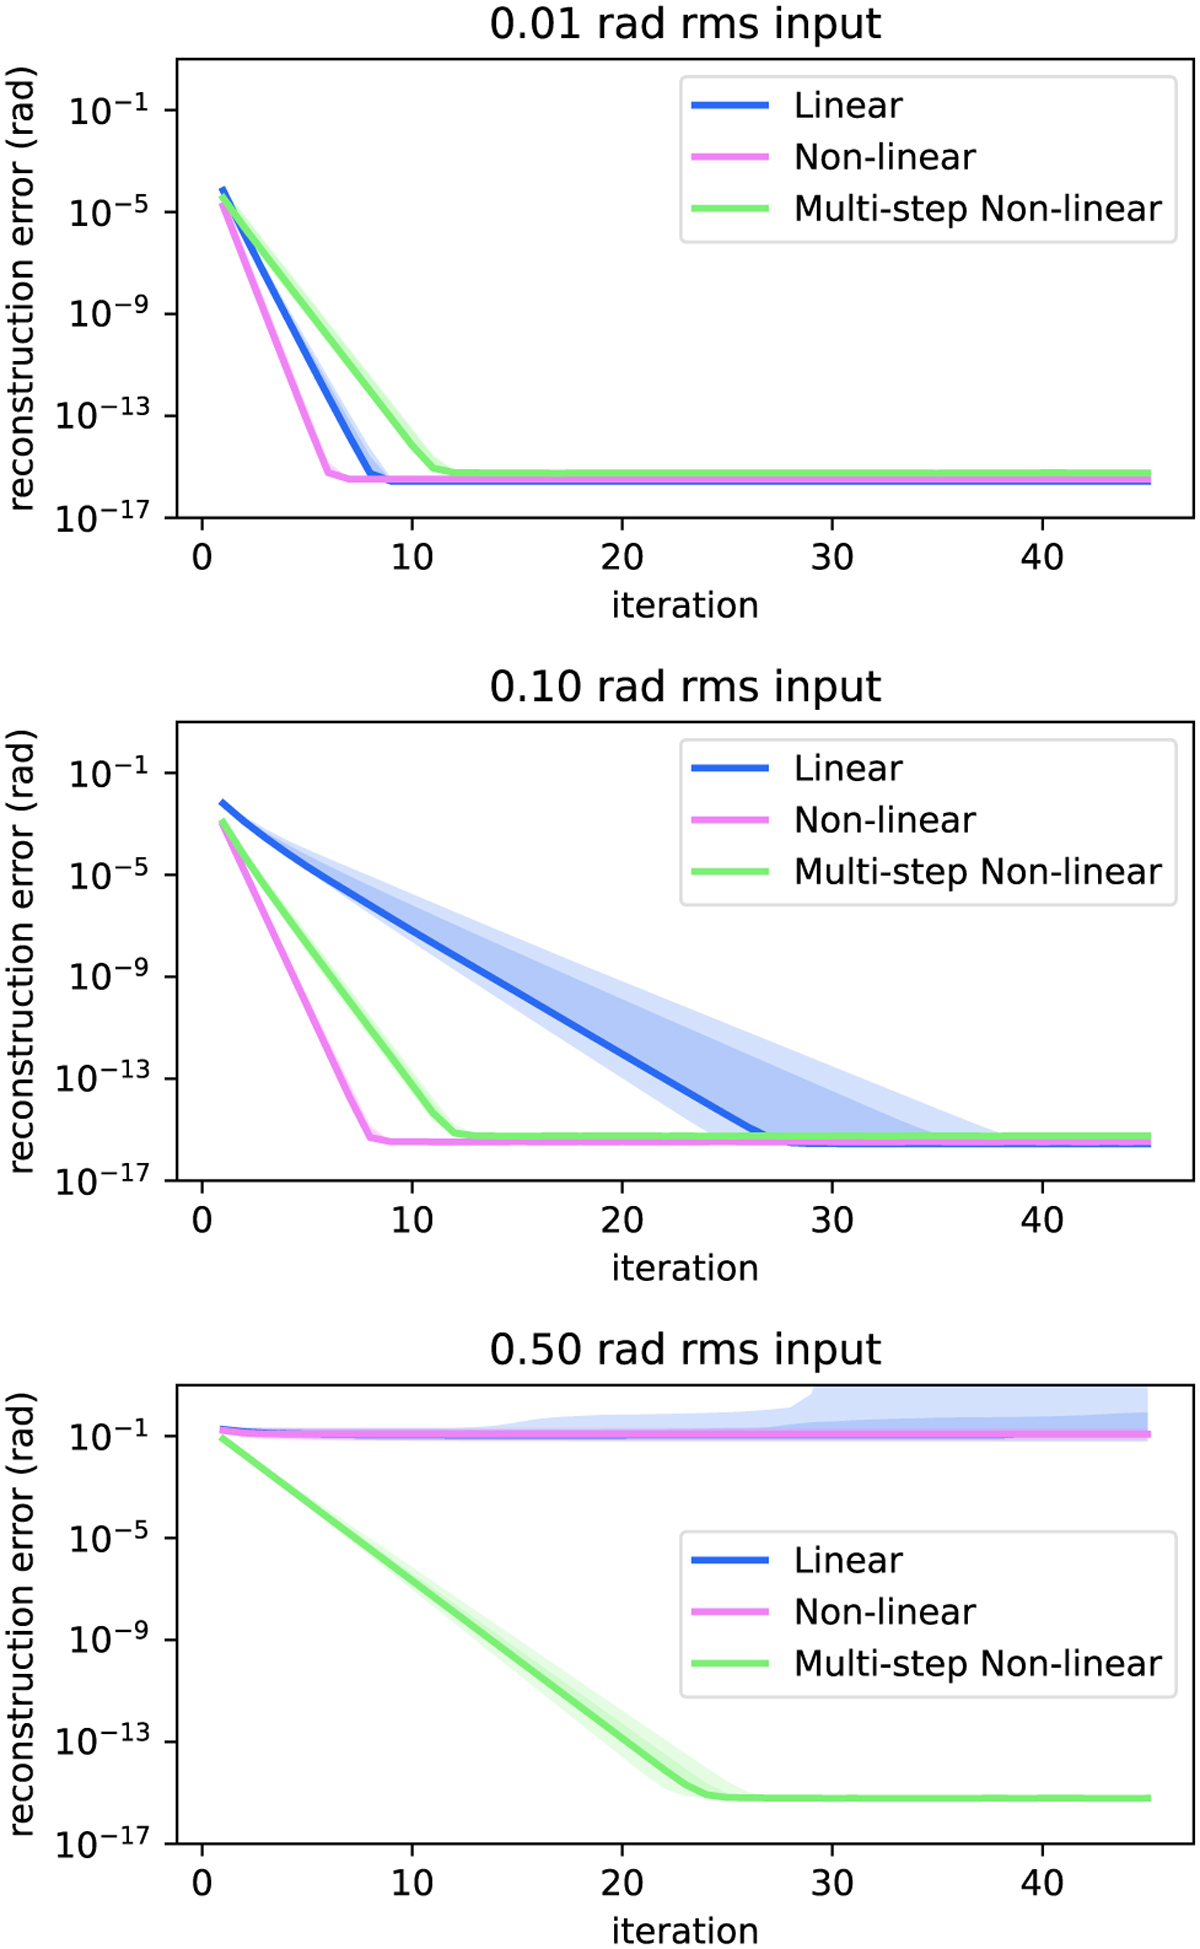
Root mean square of the residuals for different reconstructed as a function of the number of iterations. The different colored lines show the results for the linear (blue), nonlinear (purple), and the multistep (green) reconstructors. The top (0.01 rad rms), middle (0.1 rad rms), and bottom panels (0.5 rad rms) show the result for different aberration strengths. The shaded area represents the 16–84% percentile, which corresponds to the 1σ bounds. The linear and nonlinear reconstructors are able to reach machine precision for small aberrations (10−15 relative error for 64 bit floats). The nonlinear algorithm converges more quickly than the linear approach. The multistep nonlinear reconstructor converges for all considered aberration strengths.
Current usage metrics show cumulative count of Article Views (full-text article views including HTML views, PDF and ePub downloads, according to the available data) and Abstracts Views on Vision4Press platform.
Data correspond to usage on the plateform after 2015. The current usage metrics is available 48-96 hours after online publication and is updated daily on week days.
Initial download of the metrics may take a while.