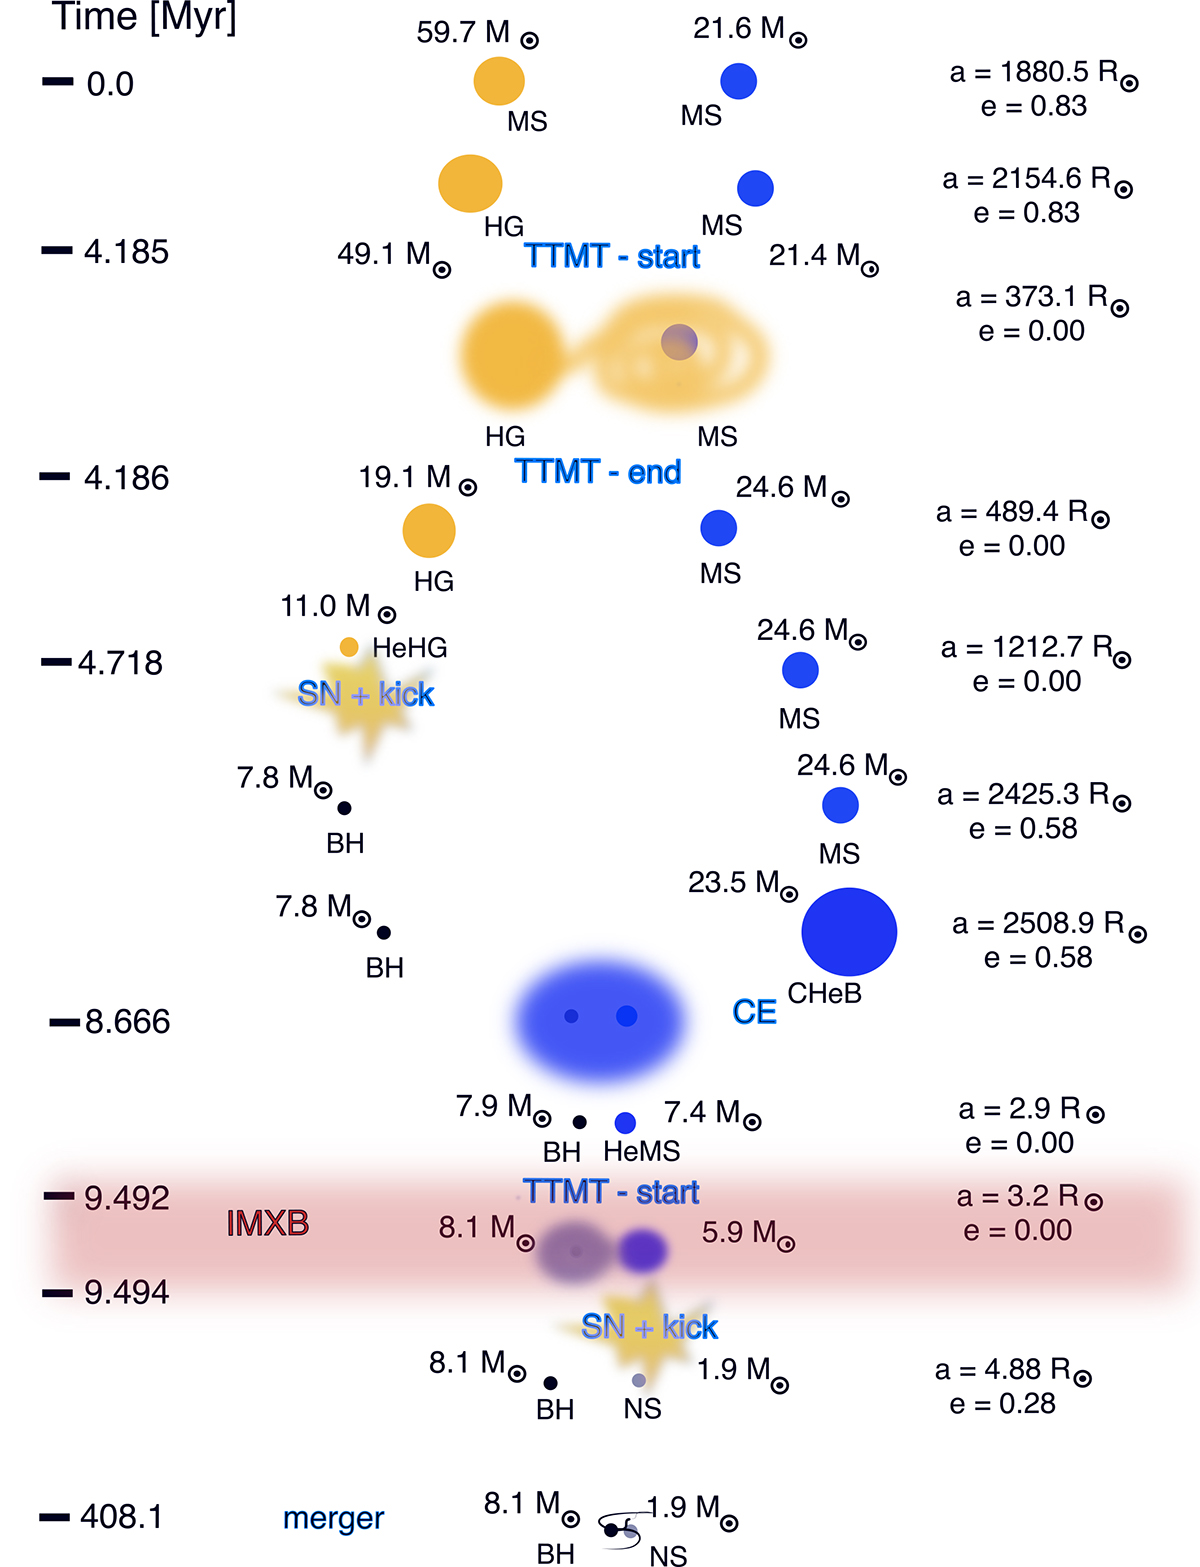
Fig. C.2.
Download original image
Typical evolution of the binary that becomes an IMXB and ends up as a merging NS-BH in Model 1. The timescale (in Myr) is shown on the left side of the panel, the masses (in M⊙) are marked next to the stars they refer to, and the orbital separation (a in R⊙) and eccentricity (e) of the system at a given stage of the evolution are shown on the right side of the panel. The acronyms on the figure are the same as in Fig. C.1.
Current usage metrics show cumulative count of Article Views (full-text article views including HTML views, PDF and ePub downloads, according to the available data) and Abstracts Views on Vision4Press platform.
Data correspond to usage on the plateform after 2015. The current usage metrics is available 48-96 hours after online publication and is updated daily on week days.
Initial download of the metrics may take a while.