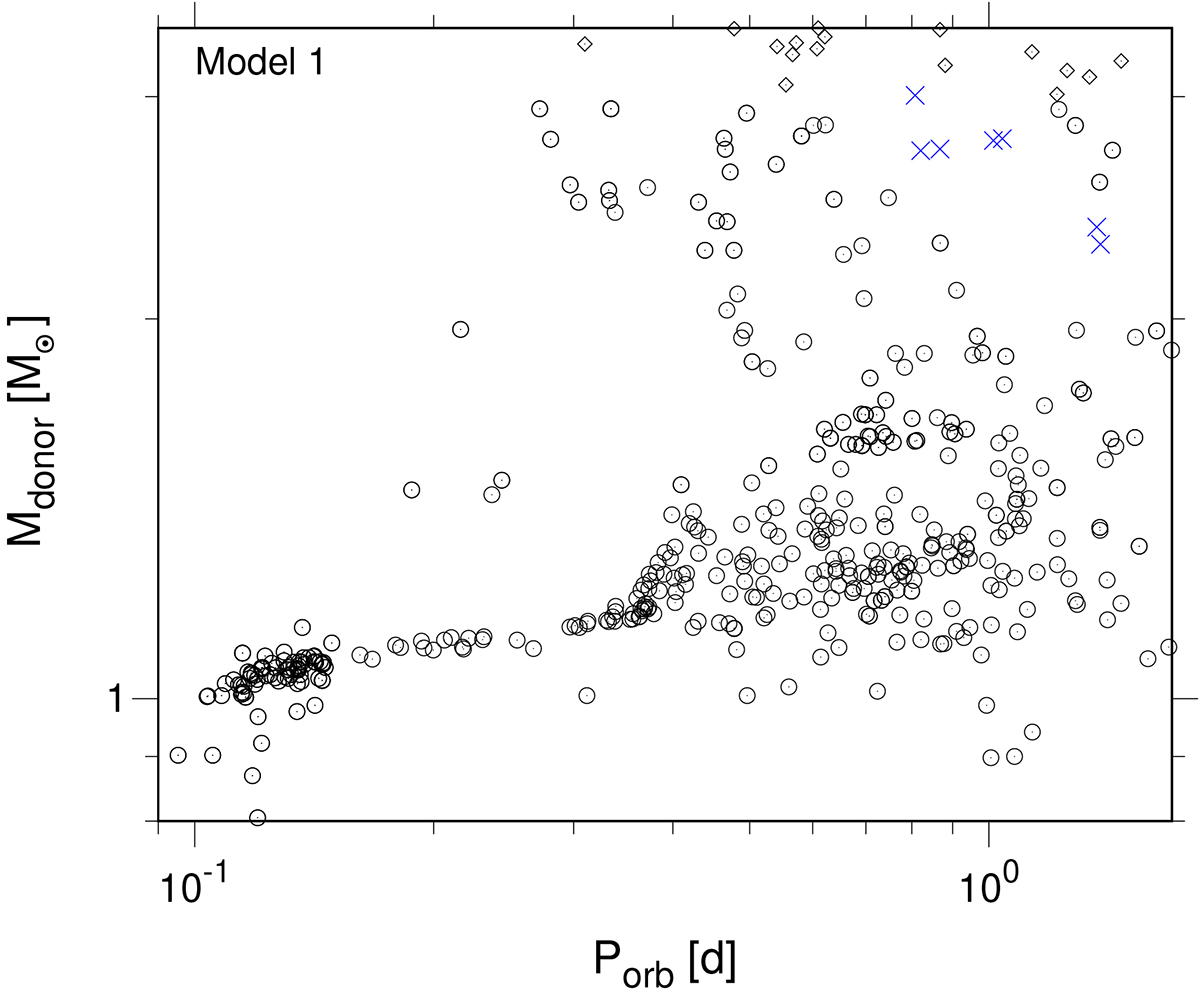
Fig. A.1.
Download original image
Zoomed-in part of the top panel (Model 1) of Fig. 3 (described in Sec. 7.2 and Sec. 7.3) where the points cluster the most. Blue crosses correspond to XRBs that form merging DCOs and open symbols show the rest of the XRB synthetic population in Model 1 (see Sec. 6.1). The figure shows that there are no XRBs that form merging DCOs with Mdonor < 2.0 M⊙ and Porb < 2.0 days. We note that the merging DCO progenitors are ten times over-represented with respect to other XRBs on the plot to show which part of the parameter space they occupy.
Current usage metrics show cumulative count of Article Views (full-text article views including HTML views, PDF and ePub downloads, according to the available data) and Abstracts Views on Vision4Press platform.
Data correspond to usage on the plateform after 2015. The current usage metrics is available 48-96 hours after online publication and is updated daily on week days.
Initial download of the metrics may take a while.