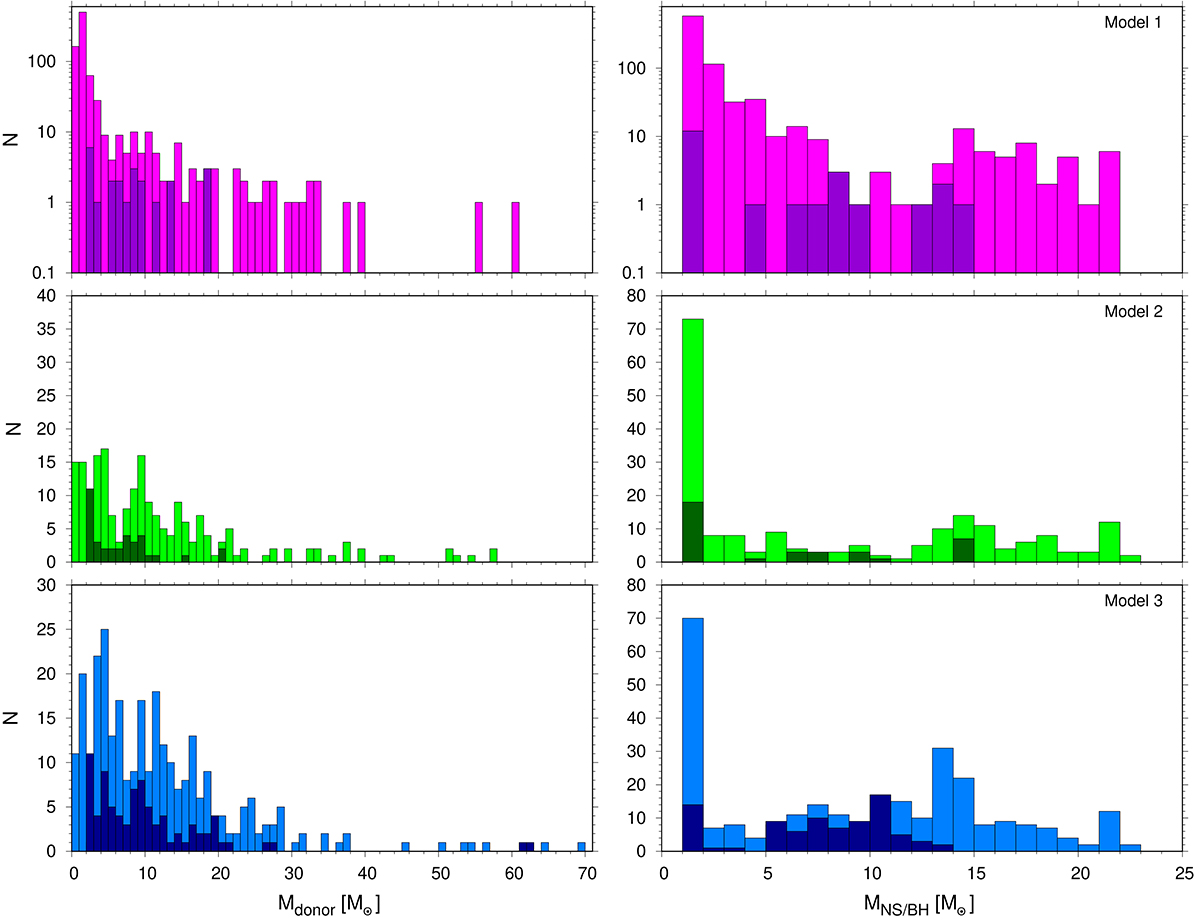
Fig. 2.
Download original image
Distributions of the donor (left column) and compact object (NS or BH; right column) masses at the onset of the XRB phase in the three models described in Sect. 6.1. The darker colors on each panel correspond to the distributions of masses of XRBs that become merging DCOs generated in ten runs for each model, as is described in Sect. 7.3. It means that the distributions for merging DCO progenitors are ten times overestimated with respect to the distributions of the other XRBs in the figure to show which part of the parameter space they occupy.
Current usage metrics show cumulative count of Article Views (full-text article views including HTML views, PDF and ePub downloads, according to the available data) and Abstracts Views on Vision4Press platform.
Data correspond to usage on the plateform after 2015. The current usage metrics is available 48-96 hours after online publication and is updated daily on week days.
Initial download of the metrics may take a while.