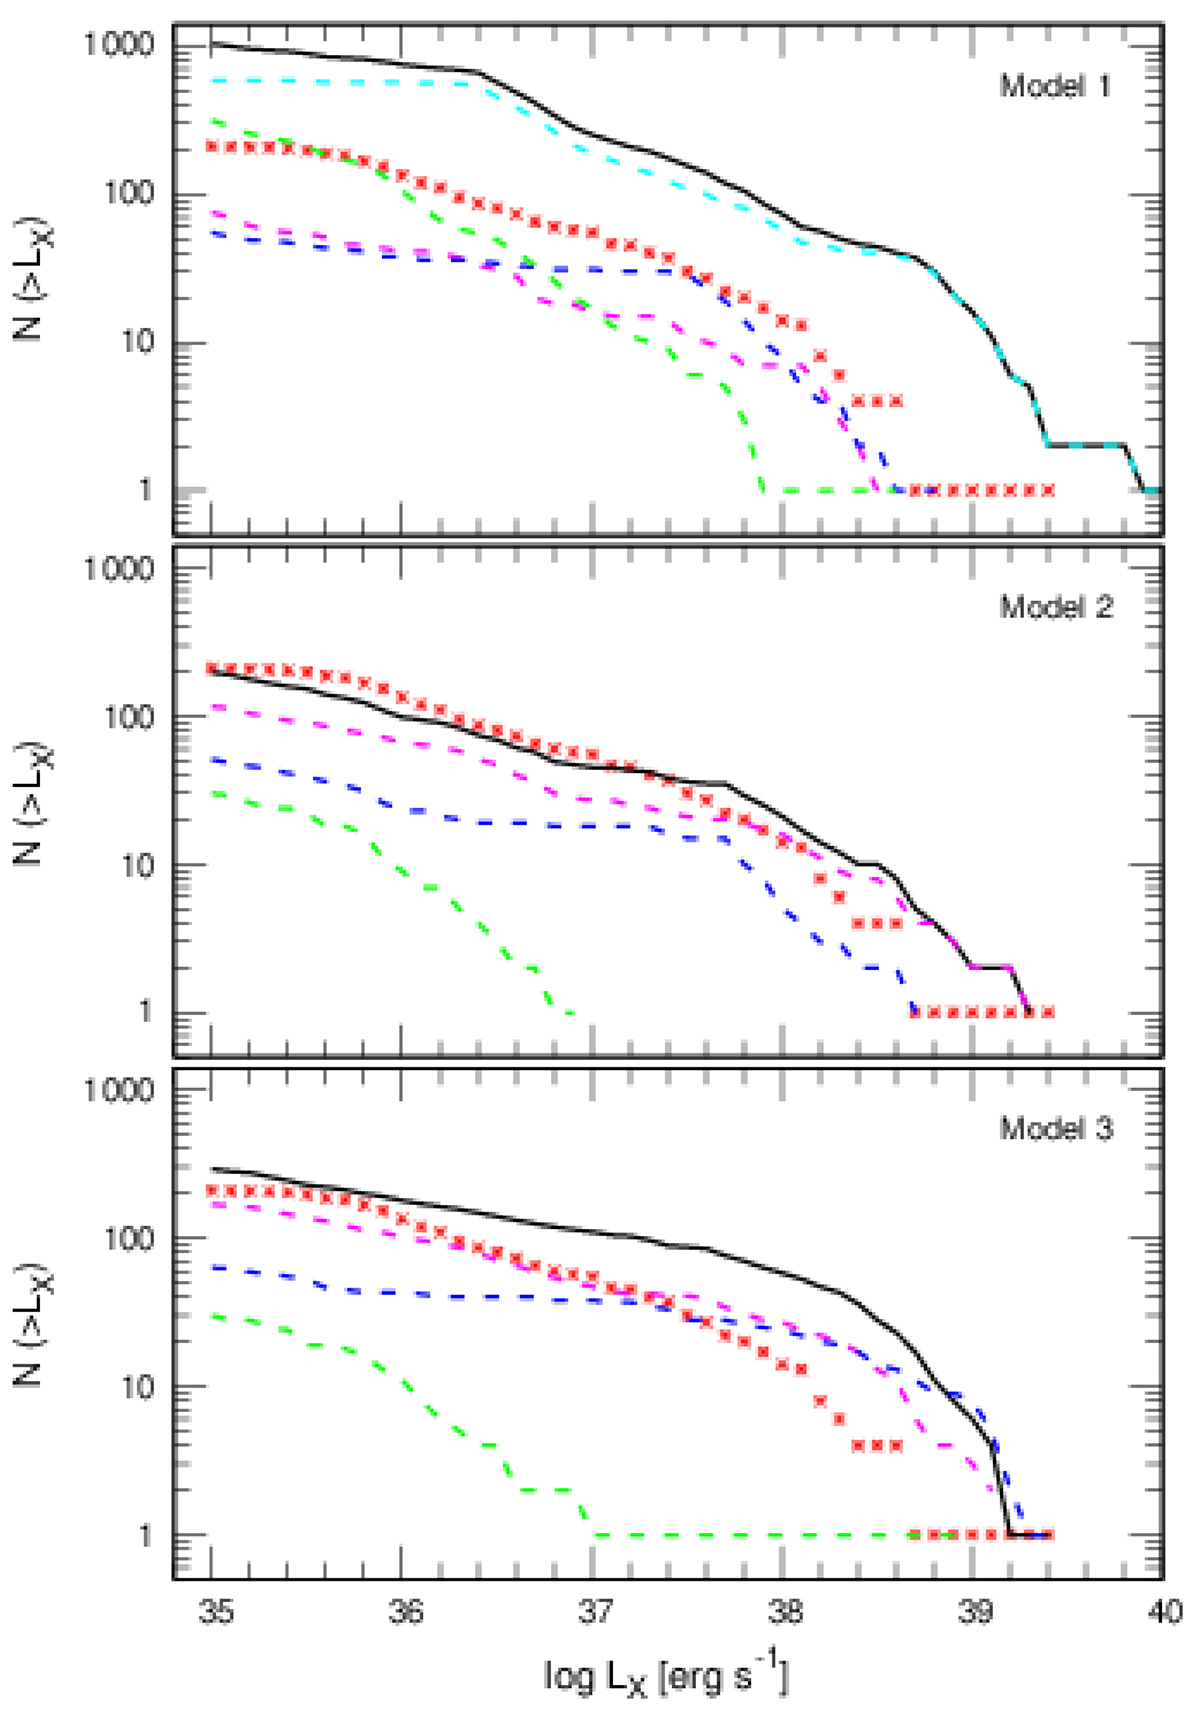
Fig. 1.

Download original image
Cumulative XLF of XRBs for M83: observations (red stars) and Model 1 (top panel), Model 2 (middle panel), and Model 3 (bottom panel). On the vertical axis is shown the number of XRBs that have a luminosity, LX, higher than the corresponding LX value on the horizontal axis. The models are plotted with solid black lines (all XRBs) and subdivided into four subcategories shown with dashed lines: HMXBs (magenta), IMBXs (blue), persistent LMXBs (cyan), outbursting transient LMXBs (green) in Model 1, or randomly selected 30 LMXBs (green) in Models 2 and 3. Model 2 is consistent with the observations in terms of the total number of XRBs and the shape of the XLF. Model 3 is close to the observations in terms of the total number of XRBs but the slope of XLF is shallower in the range log LX ∼ 36.6 − 38.6 erg s−1 than in Models 1 and 2.
Current usage metrics show cumulative count of Article Views (full-text article views including HTML views, PDF and ePub downloads, according to the available data) and Abstracts Views on Vision4Press platform.
Data correspond to usage on the plateform after 2015. The current usage metrics is available 48-96 hours after online publication and is updated daily on week days.
Initial download of the metrics may take a while.


