Fig. 4
Download original image
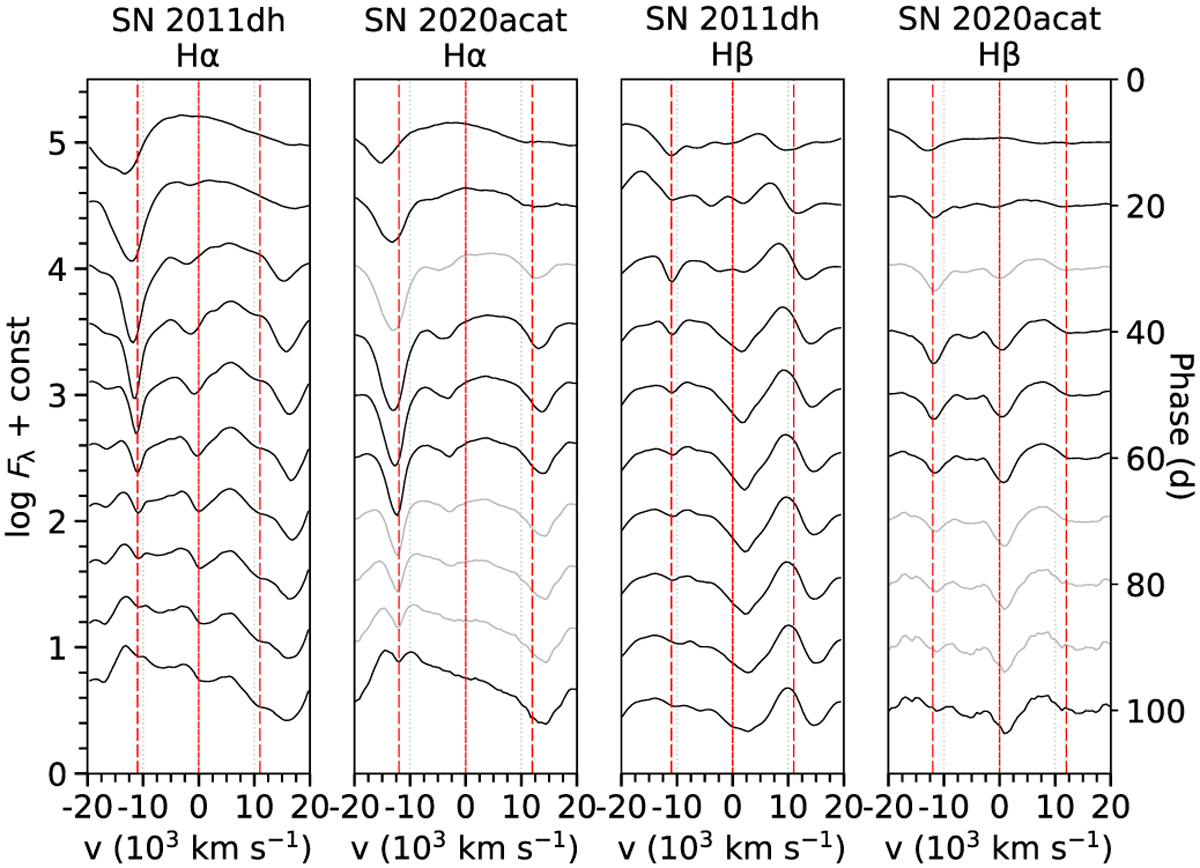
Comparison of the evolution of the Hα and Hβ lines in SN 2020acat and SN 2011dh. Spectra from ten equally spaced epochs between 10 and 100 days are shown. Interpolated spectra that have no observed counterpart close in time are shown in grey. The inferred helium-hydrogen interface velocities of SNe 2011dh (11 000 km s−1) and 2020acat (12 000 km s−1) are shown as dashed red lines.
Current usage metrics show cumulative count of Article Views (full-text article views including HTML views, PDF and ePub downloads, according to the available data) and Abstracts Views on Vision4Press platform.
Data correspond to usage on the plateform after 2015. The current usage metrics is available 48-96 hours after online publication and is updated daily on week days.
Initial download of the metrics may take a while.